
When the gas in an open container is heated, the mean free path:
1. Increases
2. Decreases
3. Remains the same
4. Any of the above depending on the molar mass
1. Increases
2. Decreases
3. Remains the same
4. Any of the above depending on the molar mass


Maxwell's speed distribution graph is drawn as shown below. The most probable speed of the gas molecules is:
1. 4 km/s

2. Between 3 km/s and 1 km/s
3. Any value between 2 km/s and 6 km/s
4. More than 4 km/s
A closed container having an ideal gas is heated gradually to increase the temperature by 20% The mean free path will become/remain:
1. 20% more
2. Same
3. 20% less
4. 33% less


| 1. | \(3:1\) | 2. | \(9:1\) |
| 3. | \(1:1\) | 4. | \(1:4\) |
Sorry!! currently, the explanation for the question is not provided. If you need further help, please email at support@neetprep.com with subject: Explanation Missing for Question Id: 160063
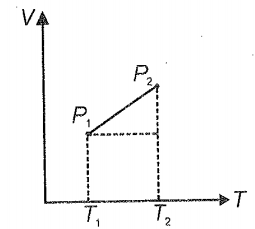
How does the temperature change when the state of an ideal gas is changed according to the process shown in the figure?

| 1. | temperature increases continuously. |
| 2. | temperature decreases continuously. |
| 3. | temperature first increases and then decreases. |
| 4. | temperature first decreases and then increases. |


The mean free path for a gas, with molecular diameter \(d\) and number density \(n,\) can be expressed as:
| 1. | \( \dfrac{1}{\sqrt{2} n \pi {d}^2} \) | 2. | \( \dfrac{1}{\sqrt{2} n^2 \pi {d}^2} \) |
| 3. | \(\dfrac{1}{\sqrt{2} n^2 \pi^2 d^2} \) | 4. | \( \dfrac{1}{\sqrt{2} n \pi {d}}\) |
A cylinder contains hydrogen gas at a pressure of \(249~\text{kPa}\) and temperature \(27^\circ\text{C}.\) Its density is:
(\(R=8.3~\text{J mol}^{-1} \text {K}^{-1}\))
1. \(0.2~\text{kg/m}^{3}\)
2. \(0.1~\text{kg/m}^{3}\)
3. \(0.02~\text{kg/m}^{3}\)
4. \(0.5~\text{kg/m}^{3}\)


(\(k_B\) is Boltzmann constant and \(T\) absolute temperature)
| 1. | \(\dfrac{3}{2}k_BT\) | 2. | \(\dfrac{5}{2}k_BT\) |
| 3. | \(\dfrac{7}{2}k_BT\) | 4. | \(\dfrac{1}{2}k_BT\) |
© 2026 GoodEd Technologies Pvt. Ltd.