
A ball is dropped from a height h above ground. Neglect the air resistance, its velocity (v) varies with its height y above the ground as
(1)
(2)
(3)
(4)


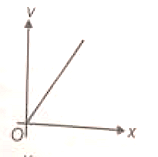
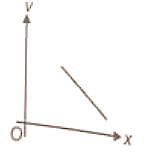
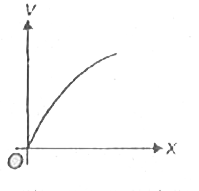
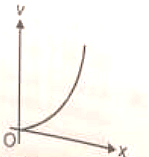
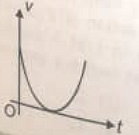
For a body moving with uniform acceleration along the straight line, the variation of its velocity (v) with position (x) is best represented by:
(1) 
(2) 
(3) 
(4) 
The position-time graph for a paricle moving along a straight line is shown in figure. The total distance travelled by it in time t=0 to t=10 s is
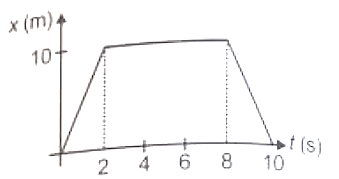
(1) Zero
(2) 10 m
(3) 20 m
(4) 80 m


The position-time graph for a body moving along the straight line between O and A is shown in During its motion between O and A, how many times the body comes to rest?
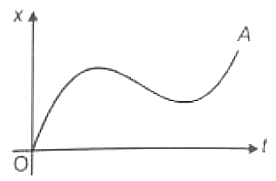
(1) Zero
(2) 1 time
(3) 2 times
(4) 3 times

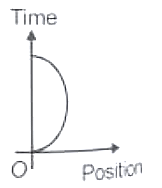
Which one of the following graph for a body moving along a straight line is possible?
(1) 
(2) 
(3) 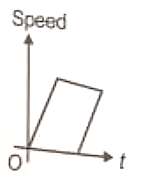
(4) 
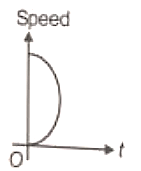
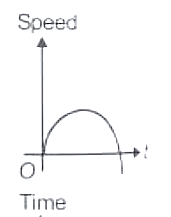
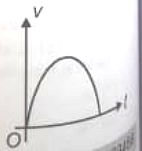
A body is projected vertically upward from ground. If we neglect the effect of air, then which one of te following is the best representation of variation of speed (v) with timw (t) ?
(1) 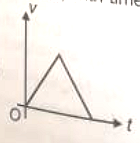
(2) 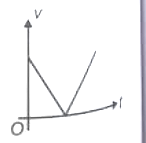
(3) 
(4) 


Which one of the following displacement-time graph represents two moving objects \(P\) and \(Q\) with zero relative velocity?
| 1. | 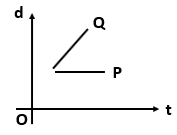 |
2. | 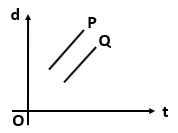 |
| 3. | 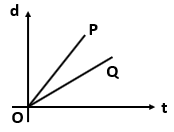 |
4. | 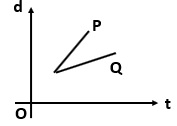 |
The displacement-time graph for two particles A and B is as follows. The ratio is
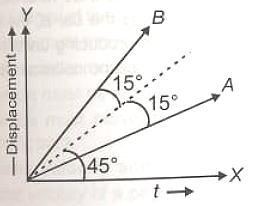
(1) 1: 2
(2) 1:
(3) : 1
(4) 1: 3
For the acceleration-time \((a-t)\) graph shown in figure, the change in velocity of particle from \(t=0\) to \(t=6~\text s\) is
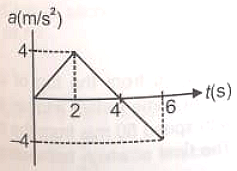

1. \(10~\text{m/s}\)
2. \(4~\text{m/s}\)
3. \(12~\text{m/s}\)
4. \(8~\text{m/s}\)


The velocity versus time graph of a body moving in a straight line is as shown in the figure below:

| 1. | The distance covered by the body in \(0\) to \(2~\text{s}\) is \(8~\text{m}\). |
| 2. | The acceleration of the body in \(0\) to \(2~\text{s}\) is \(4~\text{ms}^{-2}\). |
| 3. | The acceleration of the body in \(2\) to \(3~\text{s}\) is \(4~\text{ms}^{-2}\). |
| 4. | The distance moved by the body during \(0\) to \(3~\text{s}\) is \(6~\text{m}\). |
© 2025 GoodEd Technologies Pvt. Ltd.