
Three wires \(A,B,C\) made of the same material and radius have different lengths. The graphs in the figure show the elongation-load variation. The longest wire is:

1. \(A\)
2. \(B\)
3. \(C\)
4. All of the above


The strain-stress curves of three wires of different materials are shown in the figure. \(P\), \(Q\) and \(R\) are the elastic limits of the wires. The figure shows that:

| 1. | Elasticity of wire \(P\) is maximum. |
| 2. | Elasticity of wire \(Q\) is maximum. |
| 3. | Tensile strength of \(R\) is maximum. |
| 4. | None of the above is true. |
The diagram shows a force-extension graph for a rubber band. Consider the following statements

I. It will be easier to compress this rubber than expand it
II. Rubber does not return to its original length after it is stretched
III. The rubber band will get heated if it is stretched and released
Which of these can be deduced from the graph?
1. III only
2. II and III
3. I and III
4. I only


The adjacent graph shows the extension of a wire of length 1m suspended from the top of a roof at one end with a load W connected to the other end. If the cross sectional area of the wire is calculate the young’s modulus of the material of the wire

1.
2.
3.
4.
The diagram shows stress v/s strain curve for the materials A and B. From the curves we infer that

1. A is brittle but B is ductile
2. A is ductile and B is brittle
3. Both A and B are ductile
4. Both A and B are brittle
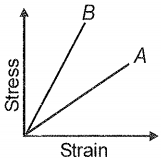
The stress versus strain graphs for wires of two materials A and B are as shown in the figure. If and are the Young ‘s modulii of the materials, then

1.
2.
3.
4.


The stress-strain curves are drawn for two different materials \(X\) and \(Y.\) It is observed that the ultimate strength point and the fracture point are close to each other for material \(X\) but are far apart for material \(Y.\) We can say that the materials \(X\) and \(Y\) are likely to be (respectively):
| 1. | ductile and brittle |
| 2. | brittle and ductile |
| 3. | brittle and plastic |
| 4. | plastic and ductile |
Within the elastic limit, the elongation \(X\) of a steel wire varies with the applied force \(F\) as shown in the graph. Which of the following graphs correctly represents this relationship?
| 1. |  |
2. |  |
| 3. |  |
4. |  |
The stress-strain curve for two materials \(A\) and \(B\) are as shown in the figure. Select the correct statement:

| 1. | Material \(A\) is less brittle and less elastic as compared to \(B\). |
| 2. | Material \(A\) is more ductile and less elastic as compared to \(B\). |
| 3. | Material \(A\) is less brittle and more elastic than \(B\). |
| 4. | Material \(B\) is more brittle and more elastic than \(A\). |


The figure below shows the stress-strain curve for two bodies A and B.
Choose the correct option.
(1) A is having greater elasticity than B.
(2) B is having a greater elasticity than A.
(3) Both A and B have the same elasticity.
(4) A and B both show plasticity.
© 2026 GoodEd Technologies Pvt. Ltd.