- 1(current)
 Q. No.
The following graph captures potential energy on the y-axis for hydrogen gas formation as a function of the internuclear distance on the x-axis:
The bond energy of H2 can be represented by:
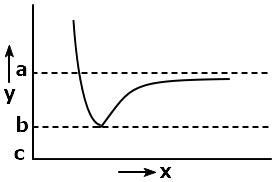
| 1. | (c – a) | 2. | (b – a) |
| 3. | (c-a)/2 | 4. | (b-a)/2 |


Subtopic: Covalent Bond |
66%
From NCERT
To view explanation, please take trial in the course.
NEET 2026 - Target Batch - Vital
Hints
To view explanation, please take trial in the course.
NEET 2026 - Target Batch - Vital

- 1(current)
Q. No.© 2025 GoodEd Technologies Pvt. Ltd.