 Q. No.
The displacement time graph of a moving particle is shown in the figure below. The instantaneous velocity of the particle is negative at the point:

| 1. | D | 2. | F |
| 3. | C | 4. | E |


In the following graph, the distance travelled by the body in metres is:

| 1. | \(200\) | 2. | \(250\) |
| 3. | \(300\) | 4. | \(400\) |
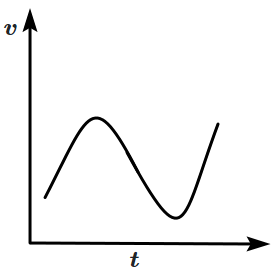
Which of the following velocity-time graphs shows a realistic situation for a body in motion?
| 1. |  |
2. |  |
| 3. |  |
4. |  |


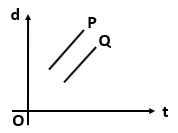
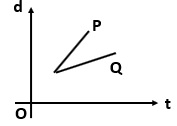
Which one of the following displacement-time graph represents two moving objects \(P\) and \(Q\) with zero relative velocity?
| 1. | 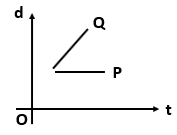 |
2. |  |
| 3. | 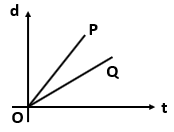 |
4. |  |
The position (\(x\)) of a particle in a straight line motion is given by \(x = 2 + 10 t - 5 t^{2}~\text{m}\). Its velocity (\(v\)) is best represented by?
| 1. |  |
2. |  |
| 3. |  |
4. |  |
The velocity-time \((v\text-t)\) graph of a body moving in a straight line is shown in the figure. The displacement and distance travelled by the body in \(6\) s are, respectively:

1. \(8\) m, \(16\) m
2. \(16\) m, \(8\) m
3. \(16\) m, \(16\) m
4. \(8\) m, \(8\) m


A particle shows distance-time curve as given in this figure. The maximum instantaneous velocity of the particle is around the point:
1. B

2. C
3. D
4. A
A particle starts from rest. Its acceleration \((a)\) versus time \((t)\) is as shown in the figure. The maximum speed of the particle will be:

1. \(110~\text{m/s}\)
2. \(55~\text{m/s}\)
3. \(550~\text{m/s}\)
4. \(660~\text{m/s}\)
A lift is going up. The variation in the speed of the lift is as given in the graph. What is the height to which the lift takes the passengers?

| 1. | \(3.6~\text{m}\) |
| 2. | \(28.8~\text{m}\) |
| 3. | \(36.0~\text{m}\) |
| 4. | It cannot be calculated from the above graph. |


A ball is thrown vertically upwards. Then the velocity-time \((v\text-t)\) graph will be:
| 1. |  |
2. |  |
| 3. |  |
4. |  |
© 2025 GoodEd Technologies Pvt. Ltd.