premium feature crown icon
Unlock IMPORTANT QUESTION
This question was bookmarked by 5 NEET 2025 toppers during their NEETprep journey. Get Target Batch to see this question.
✨ Perfect for quick revision & accuracy boost
Buy Target Batch
Access all premium questions instantly

The ratio of de-Broglie wavelength of a α-particle to that of a proton being subjected to the same magnetic field so that the radii of their path are equal to each other assuming the field induction vector B is perpendicular to the velocity vectors of the α-particle and the proton is
(1) 1                     

(2) 14
(3) 12                   

(4) 2

Subtopic:  De-broglie Wavelength |
 62%
Level 2: 60%+
Hints

premium feature crown icon
Unlock IMPORTANT QUESTION
This question was bookmarked by 5 NEET 2025 toppers during their NEETprep journey. Get Target Batch to see this question.
✨ Perfect for quick revision & accuracy boost
Buy Target Batch
Access all premium questions instantly

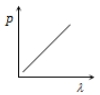
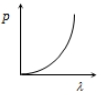
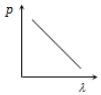
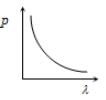
Which of the following figure represents the variation of particle momentum and the associated de-Broglie wavelength?

1. 

2. 

3. 

4. 

Subtopic:  De-broglie Wavelength |
 81%
Level 1: 80%+
Hints

premium feature crown icon
Unlock IMPORTANT QUESTION
This question was bookmarked by 5 NEET 2025 toppers during their NEETprep journey. Get Target Batch to see this question.
✨ Perfect for quick revision & accuracy boost
Buy Target Batch
Access all premium questions instantly

The stopping potential as a function of the frequency of the incident radiation is plotted for two different photoelectric surfaces A and B. The graphs show that work function of A is 

(1) Greater than that of B
(2) Smaller than that of B
(3) Equal to that of B
(4) No inference can be drawn about their work functions from the given graphs

Subtopic:  Photoelectric Effect: Experiment |
 77%
Level 2: 60%+
Hints

advertisementadvertisement

premium feature crown icon
Unlock IMPORTANT QUESTION
This question was bookmarked by 5 NEET 2025 toppers during their NEETprep journey. Get Target Batch to see this question.
✨ Perfect for quick revision & accuracy boost
Buy Target Batch
Access all premium questions instantly

The graph between intensity of light falling on a metallic plate (I) with the current (i) generated is

Subtopic:  Photoelectric Effect: Experiment |
 75%
Level 2: 60%+
Hints

premium feature crown icon
Unlock IMPORTANT QUESTION
This question was bookmarked by 5 NEET 2025 toppers during their NEETprep journey. Get Target Batch to see this question.
✨ Perfect for quick revision & accuracy boost
Buy Target Batch
Access all premium questions instantly

For a photoelectric cell the graph showing the variation of cut of voltage (V0) with frequency (v) of incident light is best represented by

Subtopic:  Photoelectric Effect: Experiment |
 75%
Level 2: 60%+
Hints

premium feature crown icon
Unlock IMPORTANT QUESTION
This question was bookmarked by 5 NEET 2025 toppers during their NEETprep journey. Get Target Batch to see this question.
✨ Perfect for quick revision & accuracy boost
Buy Target Batch
Access all premium questions instantly

The correct curve between the stopping potential (V) and intensity of incident light (I) is

Subtopic:  Photoelectric Effect: Experiment |
 82%
Level 1: 80%+
Hints

advertisementadvertisement

premium feature crown icon
Unlock IMPORTANT QUESTION
This question was bookmarked by 5 NEET 2025 toppers during their NEETprep journey. Get Target Batch to see this question.
✨ Perfect for quick revision & accuracy boost
Buy Target Batch
Access all premium questions instantly

The value of stopping potential in the following diagram

(1) – 4V
(2) – 3 V
(3) – 2V
(4) – 1 V

Subtopic:  Photoelectric Effect: Experiment |
 88%
Level 1: 80%+
Hints

premium feature crown icon
Unlock IMPORTANT QUESTION
This question was bookmarked by 5 NEET 2025 toppers during their NEETprep journey. Get Target Batch to see this question.
✨ Perfect for quick revision & accuracy boost
Buy Target Batch
Access all premium questions instantly

In the following diagram if V2>V1, then,

(1) λ1=λ2

(2) λ1<λ2

(3) λ1=λ2

(4) λ1>λ2

Subtopic:  Photoelectric Effect: Experiment |
 73%
Level 2: 60%+
Hints

premium feature crown icon
Unlock IMPORTANT QUESTION
This question was bookmarked by 5 NEET 2025 toppers during their NEETprep journey. Get Target Batch to see this question.
✨ Perfect for quick revision & accuracy boost
Buy Target Batch
Access all premium questions instantly
The curves (1), (2), (3) and (4) show the variation between the applied potential difference \((V)\) and the photoelectric current \((i)\), at two different intensities of light \((I_1>I_2)\). In which figure is the correct variation shown?
1.    2.
3. 4.
Subtopic:  Photoelectric Effect: Experiment |
 92%
Level 1: 80%+
Hints
Links

advertisementadvertisement

premium feature crown icon
Unlock IMPORTANT QUESTION
This question was bookmarked by 5 NEET 2025 toppers during their NEETprep journey. Get Target Batch to see this question.
✨ Perfect for quick revision & accuracy boost
Buy Target Batch
Access all premium questions instantly

A parallel beam of light is incident normally on a plane surface absorbing 40% of the light and reflecting the rest. If the incident beam carries 60 W of power, the force exerted by it on the surface is

(1) 3.2×10⁻⁸N

(2) 3.2×10⁻⁷N

(3) 5.12×10⁻⁷N

(4) 5.12×10⁻⁸N

Subtopic:  Photoelectric Effect: Experiment |
 67%
Level 2: 60%+
Hints