
 Q. No.
Which of the following graphs best represents the straight line \(y=-2x+5\text{?}~\)
1.

2.

3.

4.


| 1. | \(2P_0 - \dfrac{P_0V}{V_0}\) | 2. | \(3P_0 - \dfrac{P_0V}{V_0}\) |
| 3. | \(P_0 - \dfrac{P_0V}{V_0}\) | 4. | \(4P_0 - \dfrac{P_0V}{V_0}\) |
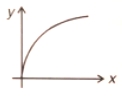
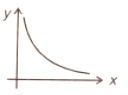
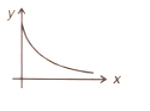
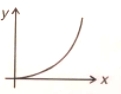


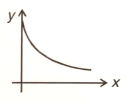
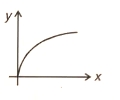
The slope of a curve between y and x changes from 0 to -5 as x changes from 0 to 5. Which of the following curve best represents the above mentioned curve?
1. 
2. 
3. 
4. 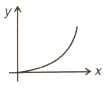


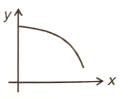
The slope of a curve is initially positive, then becomes zero, and thereafter becomes negative. Which of the following graphs best represents this behaviour?
| 1. |  |
2. |  |
| 3. |  |
4. |  |
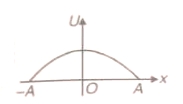
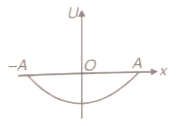
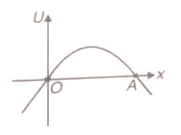
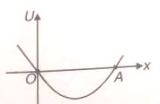
Which of the following represented to \(U-x\) graph of \(U=\dfrac{1}{2} K \left(\right. A^{2} - x^{2} \left.\right) ? \left(\right. K > 0 \left.\right)\)
1. 
2. 
3. 
4. 
For the given figure, which of the following is true?

1. \(\overrightarrow{B}= \overrightarrow{A}+\overrightarrow{C}\)
2. \(\overrightarrow{A}= \overrightarrow{B}+\overrightarrow{C}\)
3. \(\overrightarrow{C}= \overrightarrow{A}+\overrightarrow{B}\)
4. All of these


The value of the unit vector, which is perpendicular to both \(A=\hat{i} + 2\hat{j} + 3 \hat{k}\) and \(B= \hat{i} - 2\hat{j} - 3 \hat{k}\) :
1. \(\frac{\hat{i} + 2 \hat{j} + 3 \hat{k}}{6}\)
2. \(\frac{6\hat{j} -4 \hat{k}}{\sqrt{52}}\)
3. \(\frac{6\hat{j} +4 \hat{k}}{\sqrt{52}}\)
4. \(\frac{2\hat{i} - \hat{j}}{\sqrt{5}}\)
© 2026 GoodEd Technologies Pvt. Ltd.