There are many observable patterns in the physical and chemical properties of elements as we descend in a group or move across a period in the Periodic Table. For example, within a period, chemical reactivity tends to be high in Group 1 metals, lower in elements towards the middle of the table, and increases to a maximum in the Group 17 non-metals. Likewise within a group of representative metals (say alkali metals) reactivity increases on moving down the group, whereas within a group of non-metals (say halogens), reactivity decreases down the group. But why do the properties of elements follow these trends? And how can we explain periodicity? To answer these questions, we must look into the theories of atomic structure and properties of the atom. In this section we shall discuss the periodic trends in certain physical and chemical properties and try to explain them in terms of number of electrons and energy levels.
There are numerous physical properties of elements such as melting and boiling points, heats of fusion and vaporization, energy of atomization, etc. which show periodic variations. However, we shall discuss the periodic trends with respect to atomic and ionic radii, ionization enthalpy, electron gain enthalpy and electronegativity.
(a) Atomic Radius
You can very well imagine that finding the size of an atom is a lot more complicated than measuring the radius of a ball. Do you know why? Firstly, because the size of an atom
(~ 1.2 Å i.e., 1.2 × 10⁻¹⁰ m in radius) is very small. Secondly, since the electron cloud surrounding the atom does not have a sharp boundary, the determination of the atomic size cannot be precise. In other words, there is no practical way by which the size of an individual atom can be measured. However, an estimate of the atomic size can be made by knowing the distance between the atoms in the combined state. One practical approach to estimate the size of an atom of a non-metallic element is to measure the distance between two atoms when they are bound together by a single bond in a covalent molecule and from this value, the “Covalent Radius” of the element can be calculated. For example, the bond distance in the chlorine molecule (Cl2) is 198 pm and half this distance (99 pm), is taken as the atomic radius of chlorine. For metals, we define the term “Metallic Radius” which is taken as half the internuclear distance separating the metal cores in the metallic crystal. For example, the distance between two adjacent copper atoms in solid copper is 256 pm; hence the metallic radius of copper is assigned a value of 128 pm. For simplicity, in this book, we use the term Atomic Radius to refer to both covalent or metallic radius depending on whether the element is a non-metal or a metal. Atomic radii can be measured by X-ray or other spectroscopic methods.
The atomic radii of a few elements are listed in Table 3.6 . Two trends are obvious. We can explain these trends in terms of nuclear charge and energy level. The atomic size generally decreases across a period as illustrated in Fig. 3.4(a) for the elements of the second period. It is because within the period the outer electrons are in the same valence shell and the effective nuclear charge increases as the atomic number increases resulting in the increased attraction of electrons to the nucleus. Within a family or vertical column of the periodic table, the atomic radius increases regularly with atomic number as illustrated in Fig. 3.4(b). For alkali metals and halogens, as we descend the groups, the principal quantum number (n) increases and the valence electrons are farther from the nucleus. This happens because the inner energy levels are filled with electrons, which serve to shield the outer electrons from the pull of the nucleus. Consequently the size of the atom increases as reflected in the atomic radii.
Note that the atomic radii of noble gases are not considered here. Being monoatomic, their (non-bonded radii) values are very large. In fact radii of noble gases should be compared not with the covalent radii but with the van der Waals radii of other elements.
Table 3.6(a) Atomic Radii/pm Across the Periods
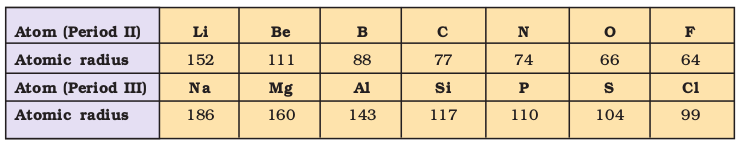
Table 3.6(b) Atomic Radii/pm Down a Family
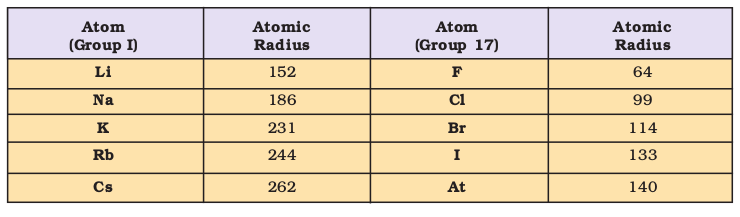
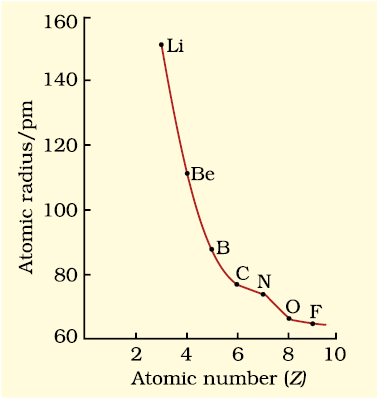
Fig. 3.4 (a) Variation of atomic radius with atomic number across the second period
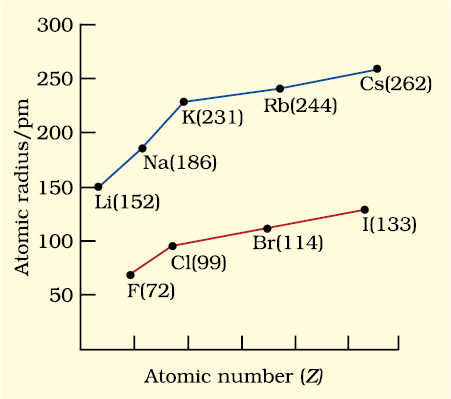
Fig. 3.4 (b) Variation of atomic radius with atomic number for alkali metals and halogens
(b) Ionic Radius
The removal of an electron from an atom results in the formation of a cation, whereas gain of an electron leads to an anion. The ionic radii can be estimated by measuring the distances between cations and anions in ionic crystals. In general, the ionic radii of elements exhibit the same trend as the atomic radii. A cation is smaller than its parent atom because it has fewer electrons while its nuclear charge remains the same. The size of an anion will be larger than that of the parent atom because the addition of one or more electrons would result in increased repulsion among the electrons and a decrease in effective nuclear charge. For example, the ionic radius of fluoride ion (F– ) is 136 pm whereas the atomic radius of fluorine is only 64 pm. On the other hand, the atomic radius of sodium is 186 pm compared to the ionic radius of 95 pm for Na+.
When we find some atoms and ions which contain the same number of electrons, we call them isoelectronic species*. For example,
O2–, F–, Na+ and Mg2+ have the same number of electrons (10). Their radii would be different because of their different nuclear charges. The cation with the greater positive charge will have a smaller radius because of the greater attraction of the electrons to the nucleus. Anion with the greater negative charge will have the larger radius. In this case, the net repulsion of the electrons will outweigh the nuclear charge and the ion will expand in size.
Problem 3.5
Which of the following species will have the largest and the smallest size? Mg, Mg2+, Al, Al3+.
Solution
Atomic radii decrease across a period. Cations are smaller than their parent atoms. Among isoelectronic species, the one with the larger positive nuclear charge will have a smaller radius.
Hence the largest species is Mg; the smallest one is Al3+.
(c) Ionization Enthalpy
A quantitative measure of the tendency of an element to lose electron is given by its Ionization Enthalpy. It represents the energy required to remove an electron from an isolated gaseous atom (X) in its ground state. In other words, the first ionization enthalpy for an element X is the enthalpy change (∆i H) for the reaction depicted in equation 3.1.
X(g) → X+(g) + e– (3.1)
The ionization enthalpy is expressed in units of kJ mol–1. We can define the second ionization enthalpy as the energy required to remove the second most loosely bound electron; it is the energy required to carry out the reaction shown in equation 3.2.
X+(g) → X2+(g) + e– (3.2)
Energy is always required to remove electrons from an atom and hence ionization enthalpies are always positive. The second ionization enthalpy will be higher than the first ionization enthalpy because it is more difficult to remove an electron from a positively charged ion than from a neutral atom. In the same way the third ionization enthalpy will be higher than the second and so on. The term “ionization enthalpy”, if not qualified, is taken as the first ionization enthalpy.
* Two or more species with same number of atoms, same number of valence electrons and same structure, regardless of the nature of elements involved.
The first ionization enthalpies of elements having atomic numbers up to 60 are plotted in Fig. 3.5. The periodicity of the graph is quite striking. You will find maxima at the noble gases which have closed electron shells and very stable electron configurations. On the other hand, minima occur at the alkali metals and their low ionization enthalpies can be correlated with their high reactivity. In addition, you will notice two trends the first ionization enthalpy generally increases as we go across a period and decreases as we descend in a group. These trends are illustrated in Figs. 3.6(a) and 3.6(b) respectively for the elements of the second period and the first group of the periodic table. You will appreciate that the ionization enthalpy and atomic radius are closely related properties. To understand these trends, we have to consider two factors : (i) the attraction of electrons towards the nucleus, and (ii) the repulsion of electrons from each other. The effective nuclear charge experienced by a valence electron in an atom will be less than the actual charge on the nucleus because of “shielding” or “screening” of the valence electron from the nucleus by the intervening core electrons. For example, the 2s electron in lithium is shielded from the nucleus by the inner core of 1s electrons. As a result, the valence electron experiences a net positive charge which is less than the actual charge of +3. In general, shielding is effective when the orbitals in the inner shells are completely filled. This situation occurs in the case of alkali metals which have single outermost ns-electron preceded by a noble gas electronic configuration.
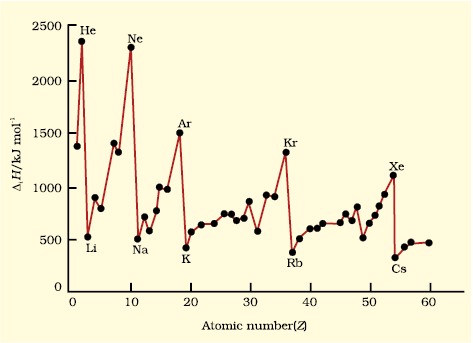
Fig. 3.5 Variation of first ionization enthalpies (∆iH) with atomic number for elements with Z = 1 to 60
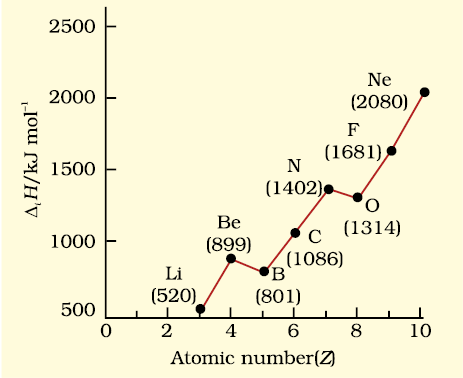
3.6 (a)
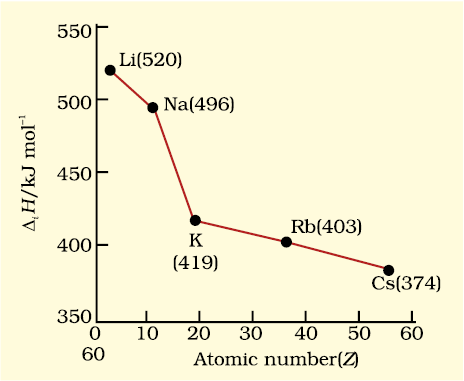
3.6 (b)
When we move from lithium to fluorine across the second period, successive electrons are added to orbitals in the same principal quantum level and the shielding of the nuclear charge by the inner core of electrons does not increase very much to compensate for the increased attraction of the electron to the nucleus. Thus, across a period, increasing nuclear charge outweighs the shielding. Consequently, the outermost electrons are held more and more tightly and the ionization enthalpy increases across a period. As we go down a group, the outermost electron being increasingly farther from the nucleus, there is an increased shielding of the nuclear charge by the electrons in the inner levels. In this case, increase in shielding outweighs the increasing nuclear charge and the removal of the outermost electron requires less energy down a group.
From Fig. 3.6(a), you will also notice that the first ionization enthalpy of boron (Z = 5) is slightly less than that of beryllium (Z = 4) even though the former has a greater nuclear charge. When we consider the same principal quantum level, an s-electron is attracted to the nucleus more than a p-electron. In beryllium, the electron removed during the ionization is an s-electron whereas the electron removed during ionization of boron is a p-electron. The penetration of a 2s-electron to the nucleus is more than that of a 2p-electron; hence the 2p electron of boron is more shielded from the nucleus by the inner core of electrons than the 2s electrons of beryllium. Therefore, it is easier to remove the 2p-electron from boron compared to the removal of a 2s- electron from beryllium. Thus, boron has a smaller first ionization enthalpy than beryllium. Another “anomaly” is the smaller first ionization enthalpy of oxygen compared to nitrogen. This arises because in the nitrogen atom, three 2p-electrons reside in different atomic orbitals (Hund’s rule) whereas in the oxygen atom, two of the four 2p-electrons must occupy the same 2p-orbital resulting in an increased electron-electron repulsion. Consequently, it is easier to remove the fourth 2p-electron from oxygen than it is, to remove one of the three 2p-electrons from nitrogen.
Problem 3.6
The first ionization enthalpy (∆i H ) values of the third period elements, Na, Mg and Si are respectively 496, 737 and 786 kJ mol–1. Predict whether the first ∆i H value for Al will be more close to 575 or 760 kJ mol–1 ? Justify your answer.
Solution
It will be more close to 575 kJ mol–1. The value for Al should be lower than that of Mg because of effective shielding of 3p electrons from the nucleus by
3s-electrons.
(d) Electron Gain Enthalpy
When an electron is added to a neutral gaseous atom (X) to convert it into a negative ion, the enthalpy change accompanying the process is defined as the Electron Gain Enthalpy (∆egH). Electron gain enthalpy provides a measure of the ease with which an atom adds an electron to form anion as represented by equation 3.3.
X(g) + e– → X–(g) (3.3)
Depending on the element, the process of adding an electron to the atom can be either endothermic or exothermic. For many elements energy is released when an electron is added to the atom and the electron gain enthalpy is negative. For example, group 17 elements (the halogens) have very high negative electron gain enthalpies because they can attain stable noble gas electronic configurations by picking up an electron. On the other hand, noble gases have large positive electron gain enthalpies because the electron has to enter the next higher principal quantum level leading to a very unstable electronic configuration. It may be noted that electron gain enthalpies have large negative values toward the upper right of the periodic table preceding the noble gases.
Table 3.7 Electron Gain Enthalpies* / (kJ mol–1) of Some Main Group Elements
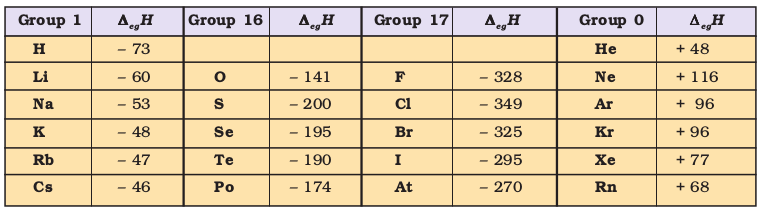
The variation in electron gain enthalpies of elements is less systematic than for ionization enthalpies. As a general rule, electron gain enthalpy becomes more negative with increase in the atomic number across a period. The effective nuclear charge increases from left to right across a period and consequently it will be easier to add an electron to a smaller atom since the added electron on an average would be closer to the positively charged nucleus. We should also expect electron gain enthalpy to become less negative as we go down a group because the size of the atom increases and the added electron would be farther from the nucleus. This is generally the case (Table 3.7). However, electron gain enthalpy of O or F is less negative than that of the succeeding element. This is because when an electron is added to O or F, the added electron goes to the smaller n = 2 quantum level and suffers significant repulsion from the other electrons present in this level. For the n = 3 quantum level (S or Cl), the added electron occupies a larger region of space and the electron-electron repulsion is much less.
Problem 3.7
Which of the following will have the most negative electron gain enthalpy and which the least negative?
P, S, Cl, F.
Explain your answer.
Solution
Electron gain enthalpy generally becomes more negative across a period as we move from left to right. Within a group, electron gain enthalpy becomes less negative down a group. However, adding an electron to the 2p-orbital leads to greater repulsion than adding an electron to the larger 3p-orbital. Hence the element with most negative electron gain enthalpy is chlorine; the one with the least negative electron gain enthalpy is phosphorus.
(e) Electronegativity
A qualitative measure of the ability of an atom in a chemical compound to attract shared electrons to itself is called electronegativity. Unlike ionization enthalpy and electron gain enthalpy, it is not a measureable quantity. However, a number of numerical scales of electronegativity of elements viz., Pauling scale, Mulliken-Jaffe scale, Allred-Rochow scale have been developed. The one which is the most widely used is the Pauling scale. Linus Pauling, an American scientist, in 1922 assigned arbitrarily a value of 4.0 to fluorine, the element considered to have the greatest ability to attract electrons. Approximate values for the electronegativity of a few elements are given in Table 3.8(a)
* In many books, the negative of the enthalpy change for the process depicted in equation 3.3 is defined as the ELECTRON AFFINITY (Ae ) of the atom under consideration. If energy is released when an electron is added to an atom, the electron affinity is taken as positive, contrary to thermodynamic convention. If energy has to be supplied to add an electron to an atom, then the electron affinity of the atom is assigned a negative sign. However, electron affinity is defined as absolute zero and, therefore at any other temperature (T) heat capacities of the reactants and the products have to be taken into account in ∆egH = –Ae – 5/2 RT.
The electronegativity of any given element is not constant; it varies depending on the element to which it is bound. Though it is not a measurable quantity, it does provide a means of predicting the nature of force that holds a pair of atoms together – a relationship that you will explore later.
Electronegativity generally increases across a period from left to right (say from lithium to fluorine) and decrease down a group (say from fluorine to astatine) in the periodic table. How can these trends be explained? Can the electronegativity be related to atomic radii, which tend to decrease across each period from left to right, but increase down each group ? The attraction between the outer (or valence) electrons and the nucleus increases as the atomic radius decreases in a period. The electronegativity also increases. On the same account electronegativity values decrease with the increase in atomic radii down a group. The trend is similar to that of ionization enthalpy.
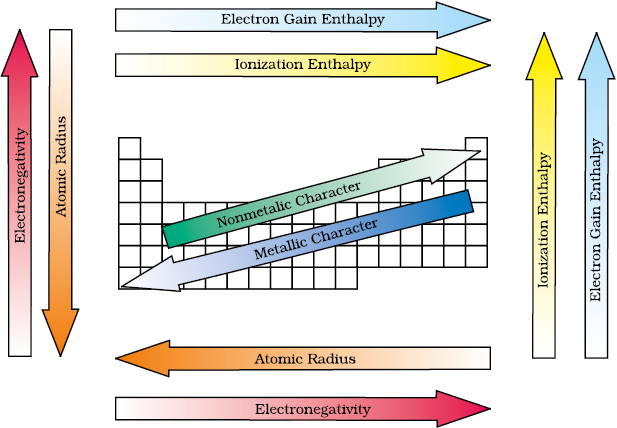
Fig. 3.7 The periodic trends of elements in the periodic table
Knowing the relationship between electronegativity and atomic radius, can you now visualise the relationship between electronegativity and non-metallic properties? Non-metallic elements have strong tendency to gain electrons. Therefore, electronegativity is directly related to that non-metallic properties of elements. It can be further extended to say that the electronegativity is inversely related to the metallic properties of elements. Thus, the increase in electronegativities across a period is accompanied by an increase in non-metallic properties (or decrease in metallic properties) of elements. Similarly, the decrease in electronegativity down a group is accompanied by a decrease in non-metallic properties (or increase in metallic properties) of elements.
All these periodic trends are summarised in figure 3.7.
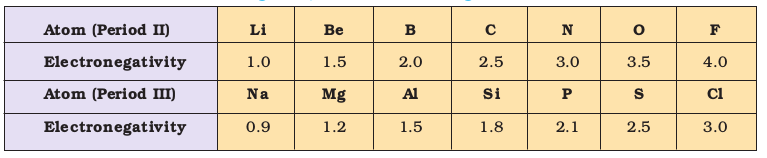
Table 3.8(a) Electronegativity Values (on Pauling scale) Across the Periods
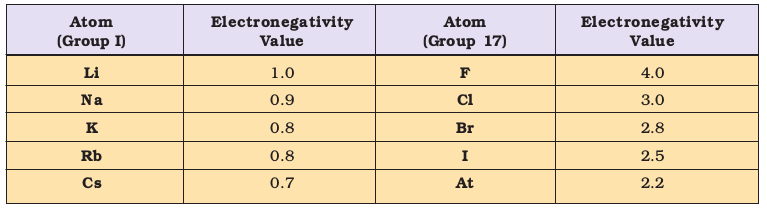
Table 3.8(b) Electronegativity Values (on Pauling scale) Down a Family
© 2026 GoodEd Technologies Pvt. Ltd.

