14. Draw a standard ECG and explain the different segments in it.
Electrocardiogram is a graphical representation of the cardiac cycle produced by an electrograph.
The diagrammatic representation of a standard ECG is shown below.
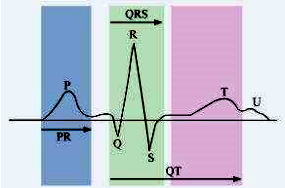
A typical human electrocardiogram has five waves – P, Q, R, S, and T. The P, R, and T-waves are above the baseline and are known as positive waves. The Q and S waves are
below the baseline and are known as negative waves. The P-wave is of atrial origin,
while the Q, R, S, and T-waves are of ventricular origin.
(a) The P-wave indicates atrial depolarization. During this wave, the impulse of contraction is generated by the SA node. The PQ-wave represents atrial contraction.
(b) The QR-wave is preceded by ventricular contraction. It represents the spread of the impulse of contraction from the AV node to the wall of the ventricle. It leads to ventricular depolarization.
(c) The RS-wave represents the ventricular contraction of about 0.3 sec.
(d) The ST-wave represents ventricular relaxation of about 0.4 sec. During this phase, the ventricles relax and return to their normal state.
(e) The T-wave represents ventricular relaxation.
© 2026 GoodEd Technologies Pvt. Ltd.

