15. With the help of suitable diagram describe the logistic population growth curve.
The logistic population growth curve is commonly observed in yeast cells that are
grown under laboratory conditions. It includes five phases: the lag phase, positive
acceleration phase, exponential phase, negative acceleration phase, and stationary
phase.
Lag phase: Initially, the population of the yeast cell is very small. This is
because of the limited resource present in the habitat.
Positive acceleration phase: During this phase, the yeast cell adapts to the
new environment and starts increasing its population. However, at the beginning
of this phase, the growth of the cell is very limited.
Exponential phase: During this phase, the population of the yeast cell
increases suddenly due to rapid growth. The population grows exponentially due
to the availability of sufficient food resources, constant environment, and the
absence of any interspecific competition. As a result, the curve rises steeply
upwards.
Negative acceleration phase: During this phase, the environmental
resistance increases and the growth rate of the population decreases. This occurs
due to an increased competition among the yeast cells for food and shelter.
Stationary phase: During this phase, the population becomes stable. The
number of cells produced in a population equals the number of cells that die. Also,
the population of the species is said to have reached nature’s carrying-capacity in
its habitat.
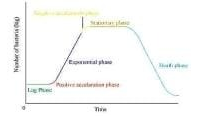
A Verhulst − pearl logistic curve is also known as an S-shaped growth curve.
© 2026 GoodEd Technologies Pvt. Ltd.

