8. Figure 13.10 shows the effect of light on the rate of photosynthesis. Based on the graph, answer the following questions:
(a) At which point/s (A, B or C) in the curve is light a limiting factor?
(b) What could be the limiting factor/s in region A?
(c) What do C and D represent on the curve?
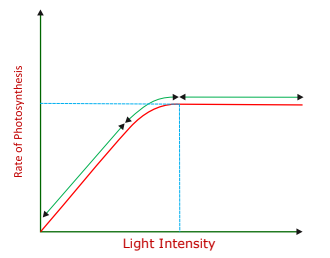
(a) Generally, light is not a limiting factor. It becomes a limiting factor for plants growing in shade or under tree canopies. In the given graph, light is a limiting factor at the point where photosynthesis is the minimum. The least value for photosynthesis is in region A. Hence, light is a limiting factor in this region.
(b) Light is a limiting factor in region A. Water, temperature, and the concentration of carbon dioxide could also be limiting factors in this region.
(c) Point D represents the optimum point and gives the light intensity at which the maximum photosynthesis is recorded. The rate of photosynthesis remains constant after this point, even though the intensity of light
© 2026 GoodEd Technologies Pvt. Ltd.

