4.15 The experimental data for decomposition of N2O5
[2N2O5 → 4NO2 + O2]
in gas phase at 318K are given below:
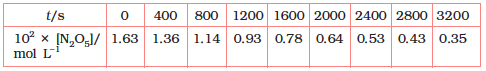
(i) Plot [N2O5] against t.
(ii) Find the half-life period for the reaction.
(iii) Draw a graph between log[N2O5] and t.
(iv) What is the rate law ?
(v) Calculate the rate constant.
(vi) Calculate the half-life period from k and compare it with (ii).
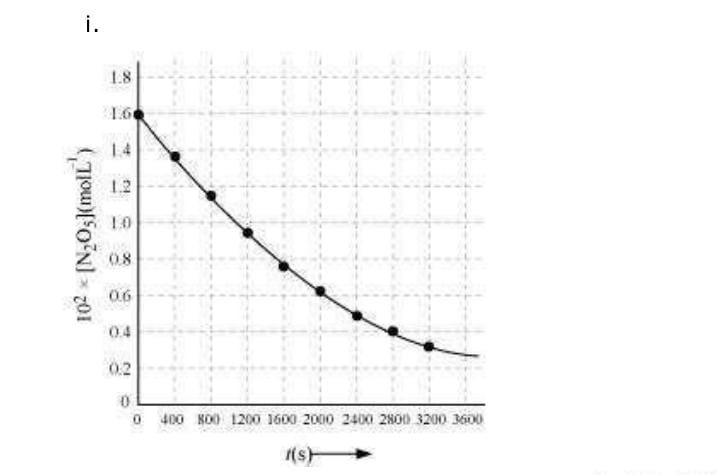
(ii) Time corresponding to the concentration, is the half
life. From the graph, the half life is obtained as 1450 s.
t(s) | log | |
0 | 1.63 | 1.79 |
400 | 1.36 | 1.87 |
800 | 1.14 | 1.94 |
1200 | 0.93 | 2.03 |
1600 | 0.78 | 2.11 |
2000 | 0.64 | 2.19 |
2400 | 0.53 | 2.28 |
2800 | 0.43 | 2.37 |
3200 | 0.35 | 2.46 |
(iv) The given reaction is of the first order as the plot, is a straight line.
Therefore, the rate law of the reaction is
Rate= K
(v) From the plot,
(vi) Half-life is given by,
This value, 1438 s, is very close to the value that was obtained from the graph.
© 2026 GoodEd Technologies Pvt. Ltd.


