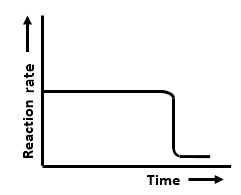
The graphs that represent a zero-order reaction are:
| (a) |   |
(b) |  |
| (c) |  |
(d) |  |
| 1. | (a, b) | 2. | (b, c) |
| 3. | (c, d) | 4. | (a, d) |
HINT:
Explanation:
Step 1:

Step 2:
On comparing with equation of straight line
y = [R] (concentration)
x = t (time)
Slope (m) = -k (rate constant)
Intercept (o) = [Ro] (initial concentration)
On rearranging Eq. (i)

NB.
The zero order reaction is independent of conc..so rate remains parallel to main axis and tht line vertical line indicates tht..this diagram is given in exemplar and same incorrect graph is every were..tht vertical line should be broken..becoz tht is to indicate the gap and parallel nature of graph.

© 2026 GoodEd Technologies Pvt. Ltd.