Suggest a suitable physical situation for each of the following graphs (Fig 3.22):
Fig. 3.22
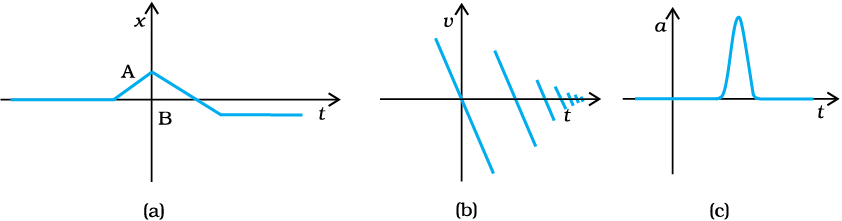
(a) The given x-t graph shows that initially, a body was at rest. Then, its velocity increases with time and attains an instantaneous constant value. The velocity then reduces to zero with an increase in time. Then, its velocity increases with time in the opposite direction and acquires a constant value. A similar physical situation arises when a football (initially kept at rest) is kicked and gets rebound from a rigid wall so that its speed gets reduced. Then, it passes from the player who has kicked it and ultimately gets stopped after some time. (b) In the given v-t graph, the sign of velocity changes, and its magnitude decreases with the passage of time. A similar situation arises when a ball is dropped on the hard floor from a height. It strikes the floor with some velocity and upon rebound, its velocity decreases by a factor. This continues till the velocity of the ball eventually becomes zero. (c) The given a-t graph reveals that initially, the body is moving with a certain uniform velocity. Its acceleration increases for a short interval of time, which again drops to zero. This indicates that the body again starts moving with the same constant velocity. A similar physical situation arises when a hammer moving with a uniform velocity strikes a nail.