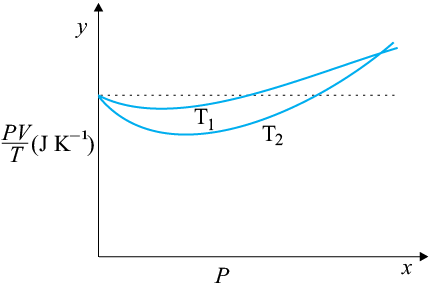
(a) The ideal behaviour of gas is shown by the dotted plot in the graph i.e., the ratio equal to nR (n is the number of moles and R is the universal gas constant) is a constant quantity. It does not depend on the pressure of the gas.
(b) The dotted plot in the graph represents an ideal gas. A gas behaves more like an ideal gas at a higher temperature and lower pressure. The curve of the gas at temperature T1 is closer to the dotted plot than the curve of the gas at temperature T2. Therefore, T1 > T2 is true for the given plot.
(c) The ideal gas equation is given by:
PV = nRT
So the value of the ratio PV/T, where the two curves meet, is nR.
(d)
Molecular mass of = 32.0 g
Mass of oxygen = 1 × kg = 1 g
No.of moles of the = mol
= 0.26 J
Therefore, the value of the ratio PV/T, where the curves meet on the y-axis, is 0.26 J .
If we obtain similar plots for 1.00 × 1 kg of hydrogen, then we will not get the same value of PV/T at the point where the curves meet the y-axis. This is because the molecular mass of hydrogen (2.02 u) is different from that of oxygen (32.0 u).
Let m is the mass of having the same value of PV/T where the two curves meet.
Molecular mass (M) of = 2.02 u
No. of moles of ,
at a constant temperature.
= 6.3 × 1 g = 6.3 × kg
Hence, 6.3 × kg of will yield the same value of PV/T.