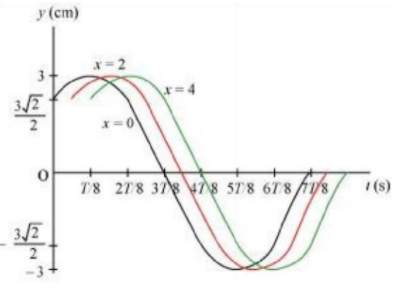
15.9 For the wave described in Exercise 15.8, plot the displacement (y) versus (t) graphs for x = 0, 2 and 4 cm. What are the shapes of these graphs? In which aspects does the oscillatory motion in the travelling wave differ from one point to another: amplitude, frequency or phase?
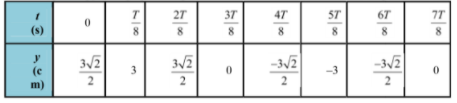
Now, plotting y vs. t graphs using the different values of t,
For x = 0, x = 2, and x = 4, the phases of the three waves will be different. This is because amplitude and frequency are constant for any change in x. The y-t plots of the three waves are shown in the given figure.
© 2026 GoodEd Technologies Pvt. Ltd.

