Q.34 A graph of potential energy V (x) versus x is shown in the figure. A particle of energy is executing motion in it. Draw graph of velocity and kinetic energy versus x for one complete cycle AFA.
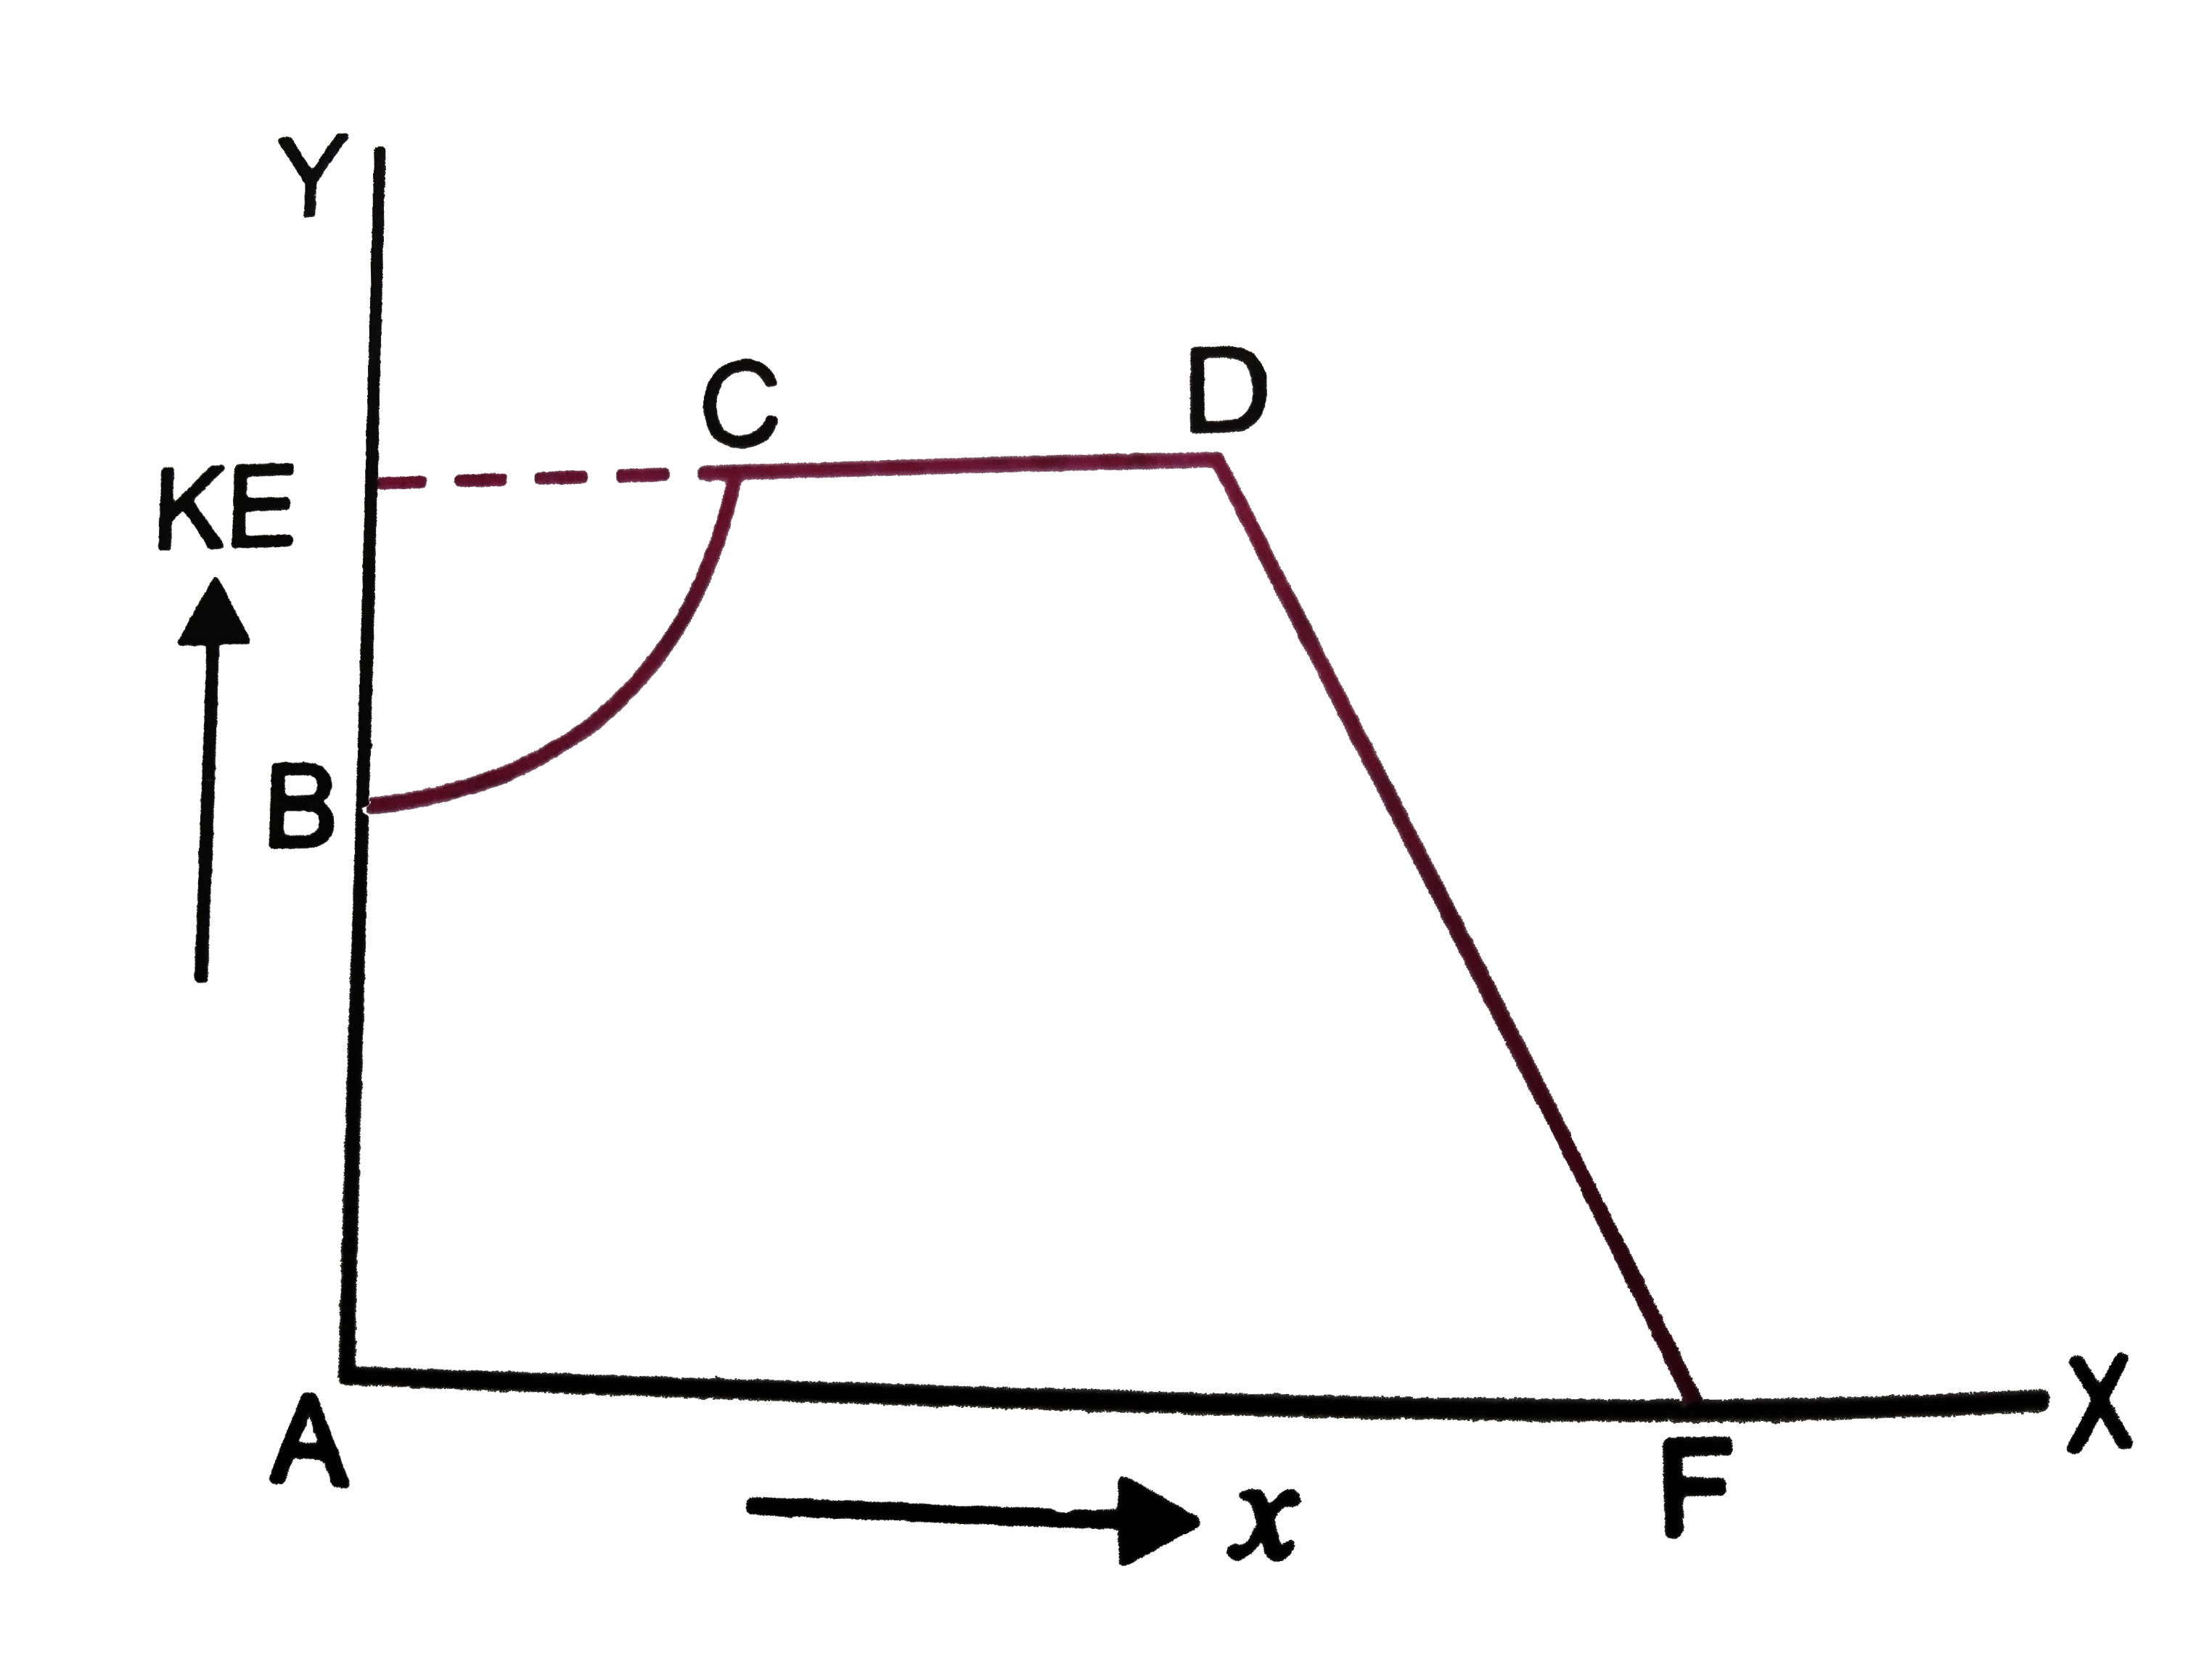
Step 1: Find KE at different points and plot KE versus x graph.
We know that
Total ME = KE + PE
at point A
at point B
Hence, KE = 0
The variation is shown in the diagram.
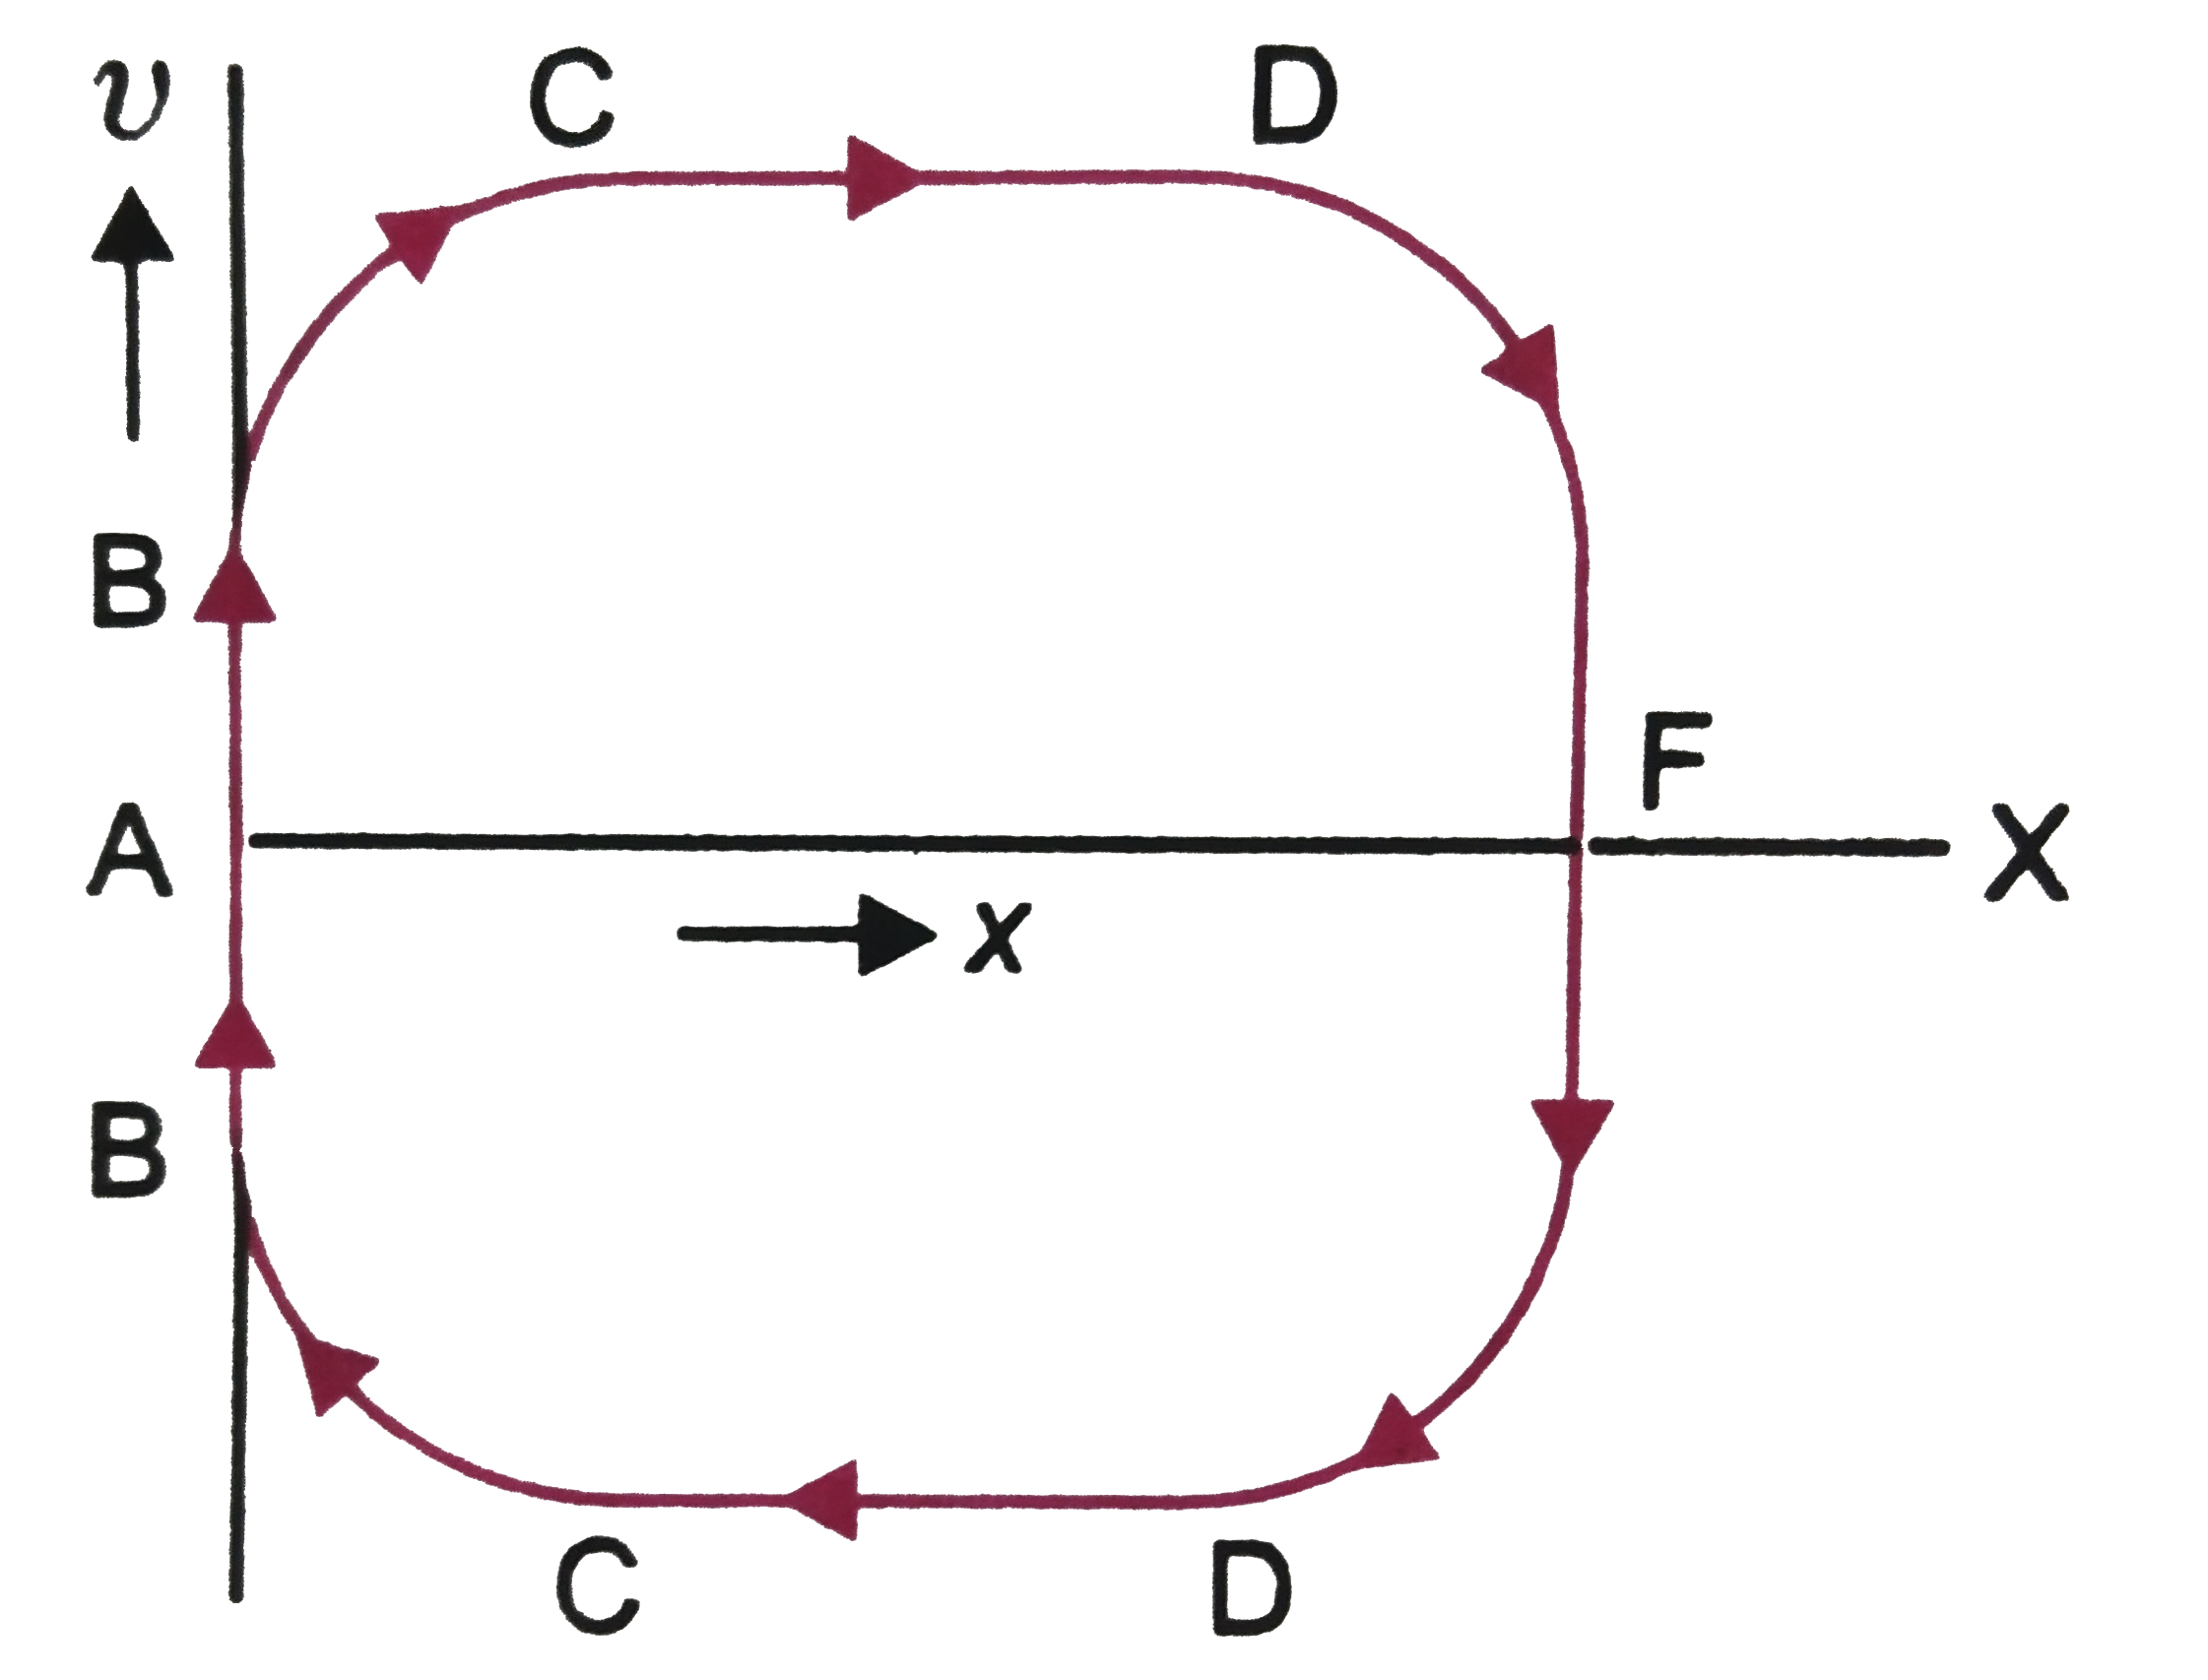
Step 2: Use and plot velocity vs x graph.
As,
At A and F. where KE = 0 v = 0
At C and D, KE is maximum. Therefore, v is ± max.
At B, KE is but not maximum.
Therefore, v is ± some value (< max)
The variation is shown in the diagram.
© 2026 GoodEd Technologies Pvt. Ltd.


