From a tower of height \(H\), a particle is thrown vertically upwards with a speed \(u\). The time taken by the particle, to hit the ground, is \(n\) times that taken by it to reach the highest point of its path. The relation between \(H,u\) and \(n\) is:
1. \( g H=(n-2)^2 u^2 \)
2. \( 2{gH}={nu}^2({n}-2) \)
3. \( g H=(n-2) u^2 \)
4. \( 2{gH}={n}^2{u}^2\)
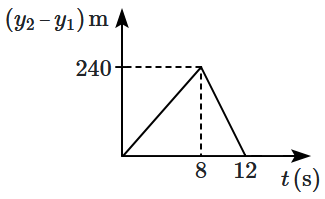
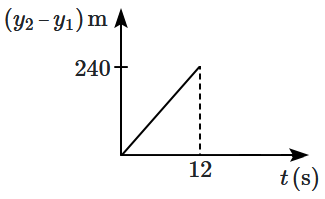
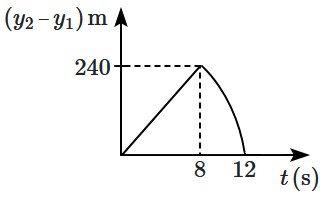
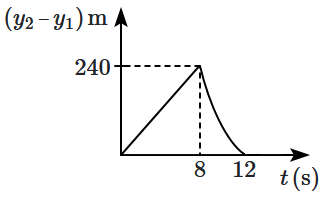
Two stones are thrown simultaneously from the edge of a cliff \(240~\text{m}\) high. The first stone is thrown upward with an initial speed of \(10~\text{m/s},\) and the second with \(40~\text{m/s}.\) Assuming the stones do not bounce after hitting the ground and neglecting air resistance (\(g= 10~\text{m/s}^2\)), which of the following graphs best represents how the position of the second stone varies relative to the first stone with time? (graphs are schematic and not drawn to scale)
| 1. |  |
| 2. |  |
| 3. |  |
| 4. |  |
A body is projected vertically upward and then allowed to fall back down under gravity. Which of the following velocity–time \((v \text-t) \) graphs correctly represents its motion throughout the ascent and descent?
| 1. |  |
2. |  |
| 3. |  |
4. |  |
| 1. |  |
2. |  |
| 3. |  |
4. |  |
1. \(\sqrt{120}~\text{s} \)
2. \(15~\text{s}\)
3. \(10\sqrt2~\text{s} \)
4. \(\sqrt{110}~\text{s} \)
The four graphs below are intended to represent the same motion. However, one of them is incorrect. Identify the graph that does not accurately depict the motion.
| 1. |  |
2. |  |
| 3. |  |
4. |  |

1. \(112.5\text{ m and}~ 22.5~ \text{s} \)
2. \(337.5\text{ m and}~ 25~ \text{s} \)
3. \(225.5\text{ m and}~ 10~ \text{s} \)
4. \(112.5\text{ m and}~ 15~ \text{s} \)
1. \(150~\text{m}\)
2. \(100~\text{m}\)
3. \(75~\text{m}\)
4. \(160~\text{m}\)
A particle starts from origin \(O\) from rest and moves with a uniform acceleration along the positive \(x\text-\)axis. Identify all figures that correctly represent the motion qualitatively.
(\(a=\) acceleration, \(v=\) velocity, \(x=\) displacement, \(t=\) time)
| (A) |  |
(B) |  |
| (C) |  |
(D) |  |
Choose the correct option from the given ones:
| 1. | (A) only |
| 2. | (A), (B) and (D) only |
| 3. | (B) and (C) only |
| 4. | (A), (B) and (C) only |
A ball is thrown vertically up (taken as \(+z\)-axis) from the ground. The correct momentum\(\text-\)height (\(p\text{-}h\)) diagram is:
| 1. |  |
2. |  |
| 3. |  |
4. |  |


