- 1(current)
 Q. No.
The figure shows the displacement-time graph of a particle moving on the x-axis. Then,

| 1. | the particle is continuously going in a positive x-direction. |
| 2. | the particle is at rest. |
| 3. | the velocity increases up to a time \(t_0\), and then becomes constant. |
| 4. | the particle moves at a constant velocity up to a time \(t_0\), and then stops. |


Subtopic: Graphs |
68%
From NCERT
To view explanation, please take trial in the course.
NEET 2023 - Target Batch - Aryan Raj Singh
Hints
To view explanation, please take trial in the course.
NEET 2023 - Target Batch - Aryan Raj Singh

The velocity-time graph of a particle moving along a straight line is shown in the adjacent figure. The average velocity is:
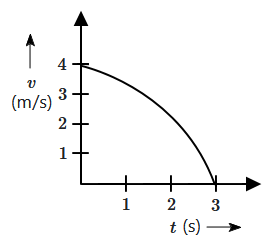
| 1. | \(1\) m/s |
| 2. | \(2\) m/s |
| 3. | less than \(1\) m/s |
| 4. | greater than \(2\) m/s |
Subtopic: Graphs |
From NCERT
Please attempt this question first.
Hints
Please attempt this question first.
Acceleration-time graph of a body is shown.
The corresponding velocity-time graph of the same body is:

| 1. |  |
2. |  |
| 3. |  |
4. |  |
Subtopic: Graphs |
64%
From NCERT
PMT - 2004
To view explanation, please take trial in the course.
NEET 2023 - Target Batch - Aryan Raj Singh
Hints
Links
To view explanation, please take trial in the course.
NEET 2023 - Target Batch - Aryan Raj Singh


The graph of displacement time is given below.

Its corresponding velocity-time graph will be:
| 1. |  |
2. |  |
| 3. |  |
4. |  |
Subtopic: Graphs |
68%
From NCERT
To view explanation, please take trial in the course.
NEET 2023 - Target Batch - Aryan Raj Singh
Hints
Links
To view explanation, please take trial in the course.
NEET 2023 - Target Batch - Aryan Raj Singh
- 1(current)
Q. No.© 2024 GoodEd Technologies Pvt. Ltd.