
 Q. No.
Annual migration does not occur in the case of
1. Salmon
2. Siberian crane.
3. Salamander.
4. arctic tern.
1. Salmon
2. Siberian crane.
3. Salamander.
4. arctic tern.


To unlock all the explanations of 38 chapters you need to be enrolled in MasterClass Course.
To unlock all the explanations of 38 chapters you need to be enrolled in MasterClass Course.

Exponential population growth is represented by
1. dt/dn=rN
2. dN/rN= dt
3. rN/dN= dt
4. dN/dt = rN
To unlock all the explanations of 38 chapters you need to be enrolled in MasterClass Course.
To unlock all the explanations of 38 chapters you need to be enrolled in MasterClass Course.
Praying mantis is a good example of
1. mullerianmimicary.
2. warning colouration.
3. social insect
4. camouflage.


Graph below is a diagrammatic representation of response of organisms to biotic factors. What do a,b,c represent respectively?
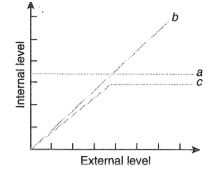
1. Partial regulator, conformer, regulator
2. Regulator, conformer, Partial regulator
3. Conformer, regulator, Partial, regulator
4. Regulator, Partial conformer, regulator
To unlock all the explanations of 38 chapters you need to be enrolled in MasterClass Course.
To unlock all the explanations of 38 chapters you need to be enrolled in MasterClass Course.
What type of human population is represented by the following age pyramid?
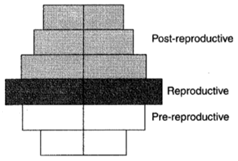
1. Expanding population
2. Vanishing population
3. Stable population
4. Declining population
To unlock all the explanations of 38 chapters you need to be enrolled in MasterClass Course.
To unlock all the explanations of 38 chapters you need to be enrolled in MasterClass Course.
Cuscuta is an example of
1. predation.
2. endoparasitism.
3. ectoparasitism.
4. brood parasitism.
To unlock all the explanations of 38 chapters you need to be enrolled in MasterClass Course.
To unlock all the explanations of 38 chapters you need to be enrolled in MasterClass Course.
A sedentary sea anemone gets attached to the sheel lining of hermit crab. The association is
1. ectoparasitism
2. symbiosis.
3. commensalism.
4. amensalism.
The following graph depicts changes in two populations (A and B) of herbivores in a grassy field. A possible reason for these changes is that
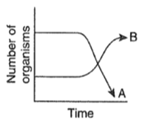
1. both plant populations in this habitat decreased.
2. population B competed more successfully for food than population A.
3. population A produced more offspring than population B.
4. population A consumed the members of population B.
To unlock all the explanations of 38 chapters you need to be enrolled in MasterClass Course.
To unlock all the explanations of 38 chapters you need to be enrolled in MasterClass Course.
When does the growth rate of a population following the logistic model equal zero? The logistic model is given
As dN/dt=rN(1─N/K)
1. when N/K is exactly one.
2. when N nears the carrying capacity of the habitat.
3. when N/K equals zero.
4. when death rate is greater than birth rate.
Which of the following is correct for r-selected species?
1. Large number of progeny with large size.
2. Small number of progeny with small size.
3. Small number of progeny with large size.
4. Large number of progeny with small size.
To unlock all the explanations of 38 chapters you need to be enrolled in MasterClass Course.
To unlock all the explanations of 38 chapters you need to be enrolled in MasterClass Course.
© 2024 GoodEd Technologies Pvt. Ltd.