Select Chapter Topics:

 Q. No.
Two rods of the same length and the same area of the cross-section are joined. The temperature of the two ends is shown in the figure.

As we move along the rod, temperature varies as shown in the following figure. Then:

1. \(K_{1}>K_{2}\)
2. \(K_{1}=K_{2}\)
3. \(K_{1}<K_{2}\)
4. None of these
1. \(K_{1}>K_{2}\)
2. \(K_{1}=K_{2}\)
3. \(K_{1}<K_{2}\)
4. None of these


Subtopic: Conduction |
57%
From NCERT
To view explanation, please take trial in the course.
NEET 2023 - Target Batch - Aryan Raj Singh
Hints
To view explanation, please take trial in the course.
NEET 2023 - Target Batch - Aryan Raj Singh

Two different liquids of the same mass are kept in two identical vessels which are placed in a freezer that extracts heat from them at the same rate causing each liquid to transform into a solid. The schematic figure below shows the temperature \(T\) versus time \(t\) plot for the two materials. We denote the specific heat in the liquid states to be \(C_{L_1}\) and \(C_{L_2}\) for materials 1 and 2 respectively and latent heats of fusion respectively.

Choose the correct option:
| 1. | \(C_{L_1}>C_{L_2}~\text{and }U_1<U_2\) |
| 2. | \(C_{L_2}>C_{L_1}~\text{and }U_1<U_2\) |
| 3. | \(C_{L_1}<C_{L_2}~\text{and }U_1>U_2\) |
| 4. | \(C_{L_1}<C_{L_2}~\text{and }U_1<U_2\) |
Subtopic: Calorimetry |
From NCERT
To view explanation, please take trial in the course.
NEET 2023 - Target Batch - Aryan Raj Singh
Hints
To view explanation, please take trial in the course.
NEET 2023 - Target Batch - Aryan Raj Singh
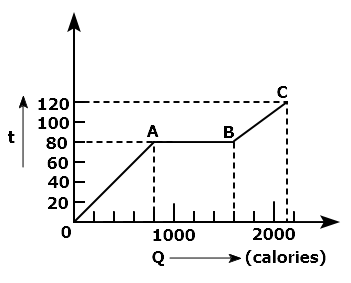
A substance is in solid form at \(0^{\circ}\mathrm{C}\). The amount of heat added to this substance and its temperature are plotted in the following graph. If the relative specific heat capacity of the solid substance is 0.5, from the graph, the specific latent heat of the melting process is: (Specific heat capacity of water = 1000 cal kg-1 K-1 )
1. 60000 cal kg-1
2. 40000 cal kg-1
3. 10000 cal kg-1
4. 20000 cal kg-1
Subtopic: Calorimetry |
65%
From NCERT
To view explanation, please take trial in the course.
NEET 2023 - Target Batch - Aryan Raj Singh
Hints
Links
To view explanation, please take trial in the course.
NEET 2023 - Target Batch - Aryan Raj Singh


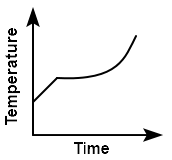
Liquid oxygen at \(50\) K is heated up to \(300\) K at a constant pressure of \(1\) atm. The rate of heating is constant. Which one of the following graphs represents the variation of temperature with time?
| 1. |  |
2. |  |
| 3. |  |
4. |  |
Subtopic: Calorimetry |
81%
From NCERT
AIPMT - 2012
To view explanation, please take trial in the course.
NEET 2023 - Target Batch - Aryan Raj Singh
Hints
Links
To view explanation, please take trial in the course.
NEET 2023 - Target Batch - Aryan Raj Singh
A body cools in a surrounding which is at a constant temperature of . Assuming that it obeys Newton's law of cooling, its temperature is plotted against time t. Tangents are drawn to the curve at the points A(=1) and B(=2). These tangents meet the time-axis at angles 1 and 2 as shown in the graph then:

1.
2.
3.
4.
Subtopic: Newton's Law of Cooling |
61%
To view explanation, please take trial in the course.
NEET 2023 - Target Batch - Aryan Raj Singh
Hints
In the adjoining figure, various isothermals are shown for a real gas. Then:

1. EF represents liquification
2. CB represents liquification
3. HI represents the critical temperature
4. AB represents gas at a high temperature
Subtopic: Calorimetry |
51%
To view explanation, please take trial in the course.
NEET 2023 - Target Batch - Aryan Raj Singh
Hints
Radius of a conductor increases uniformly from left end to right end as shown in the figure.
The material of the conductor is isotropic and its curved surface is thermally isolated from its surrounding. Its ends are maintained at temperatures \(T_1\) and \(T_2~(T_1>T_2).\) If in steady state, heat flow rate is equal to \(H,\) then which of the following graphs is correct?

| 1. |  |
2. |  |
| 3. |  |
4. |  |
Subtopic: Conduction |
53%
From NCERT
To view explanation, please take trial in the course.
NEET 2023 - Target Batch - Aryan Raj Singh
Hints
To view explanation, please take trial in the course.
NEET 2023 - Target Batch - Aryan Raj Singh
For a small temperature difference between the body and the surroundings, the relation between the rate of loss heat \(R\) and the temperature of the body \(\theta\) is depicted by:
| 1. |  |
2. |  |
| 3. |  |
4. |  |
Subtopic: Conduction |
From NCERT
To view explanation, please take trial in the course.
NEET 2023 - Target Batch - Aryan Raj Singh
Hints
To view explanation, please take trial in the course.
NEET 2023 - Target Batch - Aryan Raj Singh
The adjoining diagram shows the spectral energy density distribution \(E_{\lambda}\) of a black body at two different temperatures. If the areas under the curves are in the ratio \(16:1,\) the value of temperature \(T\) is:
1. \(32000\) K
2. \(16000\) K
3. \(8000\) K
4. \(4000\) K

Subtopic: Stefan-Boltzmann Law |
57%
From NCERT
To view explanation, please take trial in the course.
NEET 2023 - Target Batch - Aryan Raj Singh
Hints
To view explanation, please take trial in the course.
NEET 2023 - Target Batch - Aryan Raj Singh
If is the wavelength, corresponding to which the radiant intensity of a block is at its maximum and its absolute temperature is T, then which of the following graph correctly represents the variation of T?
| 1. |  |
2. |  |
| 3. |  |
4. |  |
Subtopic: Wien's Displacement Law |
74%
From NCERT
To view explanation, please take trial in the course.
NEET 2023 - Target Batch - Aryan Raj Singh
Hints
Links
To view explanation, please take trial in the course.
NEET 2023 - Target Batch - Aryan Raj Singh
Select Chapter Topics:
© 2024 GoodEd Technologies Pvt. Ltd.