- 1(current)
 Q. No.
The stress-strain curves are drawn for two different materials \(X\) and \(Y.\) It is observed that the ultimate strength point and the fracture point are close to each other for material \(X\) but are far apart for material \(Y.\) We can say that the materials \(X\) and \(Y\) are likely to be (respectively):
| 1. | ductile and brittle |
| 2. | brittle and ductile |
| 3. | brittle and plastic |
| 4. | plastic and ductile |


The figure shows the strain-stress curve for a given material. What is Young’s modulus for this material?
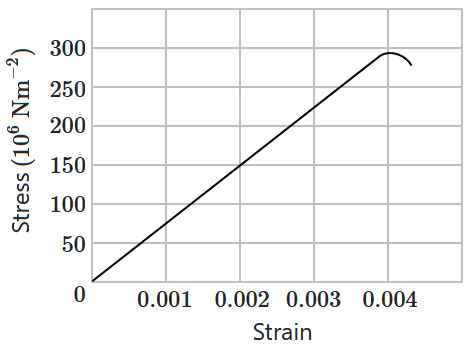
1. \(7.5\times10^{11}~\text{Nm}^{-2}\)
2. \(7.5\times10^{10}~\text{Nm}^{-2}\)
3. \(7.5\times10^{9}~\text{Nm}^{-2}\)
4. \(7.5\times10^{-10}~\text{Nm}^{-2}\)
The stress-strain graphs for materials \(A\) and \(B\) are shown in the figure. The strength of the material \(A\) is:
(The graphs are drawn to the same scale)

| 1. | greater than material \(B\) |
| 2. | equal to material \(B\) |
| 3. | less than material \(B\) |
| 4. | insufficient data |


| 1. |  |
2. |  |
| 3. |  |
4. |  |
- 1(current)
Q. No.© 2025 GoodEd Technologies Pvt. Ltd.