Are you sure?
This action cannot be undone. This will permanently delete All Practiced Questions.
Warning !
Only bookmarked questions of selected question set or default questions are shown here. Click Here to view all bookmarked questions of the chapter
Question No.
Are you sure?
Type delete to confirm.
- 1(current)
Unlock IMPORTANT QUESTION
This question was bookmarked by 5 NEET 2025 toppers during their NEETprep journey. Get Target Batch to see this question.
✨ Perfect for quick revision & accuracy boost
Buy Target Batch
Access all premium questions instantly
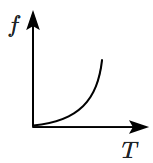
The graph between fundamental frequency \((f)\) and corresponding tension \((T)\) in a sonometer wire is best represented by:
| 1. |  |
2. |  |
| 3. |  |
4. |  |
Add Note
Subtopic: Travelling Wave on String |
59%
Level 3: 35%-60%
Other Reason
Highlight in NCERT
Hints
Upgrade Your Plan
Upgrade now and unlock your full question bank experience with daily practice.
- 1(current)

- 8527521718
- support@neetprep.com
- S-15, 2nd floor Uphar Cinema Market, above Red Chilli Restaurant, Green Park Extension, New Delhi, 110016
Botany Questions
- Living World
- Biological Classification
- Plant Kingdom
- Morphology of Flowering Plants
- Anatomy of Flowering Plants
- Cell-unit of Life
- Cell Cycle and Cell Division
- Transport in Plants
- Mineral Nutrition
- Photosynthesis in Higher Plants
- Respiration in Plants
- Plant Growth and Development
- Reproduction in Organisms
- Sexual Reproduction in Flowering Plants
- Principles of Inheritance and Variation
- Molecular Basis of Inheritance
- Strategies for Enhancement in Food Production
- Microbes in Human Welfare
- Organisms and Populations
- Ecosystem
- Biodiversity and Conservation
- Environmental Issues
Chemistry Questions
- Some Basic Concepts of Chemistry
- Structure of Atom
- Classification of Elements and Periodicity in Properties
- Chemical Bonding and Molecular Structure
- States of Matter
- Thermodynamics
- Equilibrium
- Redox Reactions
- Hydrogen
- The s-Block Elements
- The p-Block Elements-XI
- Organic Chemistry - Some Basic Principles and Techniques
- Hydrocarbons
- Environmental Chemistry
- The Solid State
- Solutions
- Electrochemistry
- Chemical Kinetics
- Surface Chemistry
- General Principles and Processes of Isolation of Elements
- The p-Block Elements-XII
- The d and f Block Elements
- Coordination Compounds
- Haloalkanes and Haloarenes
- Alcohols, Phenols and Ethers
- Aldehydes, Ketones and Carboxylic Acids
- Amines
- Biomolecules
- Polymers
- Chemistry in Everyday Life
Physics Questions
- Units and Measurement
- Mathematical Tools
- Motion in A Straight Line
- Motion in A Plane
- Laws of Motion
- Work, Energy and Power
- Systems of Particles and Rotational Motion
- Gravitation
- Mechanical Properties of Solids
- Mechanical Properties of Fluids
- Thermal Properties of Matter
- Thermodynamics
- Kinetic Theory of Gases
- Oscillations
- Waves
- Electric Charges and Fields
- Electrostatic Potential and Capacitance
- Current Electricity
- Moving Charges and Magnetism
- Magnetism and Matter
- Electromagnetic Induction
- Alternating Current
- Electromagnetic Waves
- Ray Optics and Optical Instruments
- Wave Optics
- Dual Nature of Radiation and Matter
- Atoms
- Nuclei
- Semiconductor Electronics
Zoology Questions
- Animal Kingdom
- Structural Organisation in Animals
- Biomolecules
- Digestion and Absorption
- Breathing and Exchange of Gases
- Body Fluids and Circulation
- Excretory Products and their Elimination
- Locomotion and Movement
- Neural Control and Coordination
- Chemical Coordination and Integration
- Human Reproduction
- Reproductive Health
- Evolution
- Human Health and Disease
- Biotechnology Principles and Processes
- Biotechnology and its Application
© 2025 GoodEd Technologies Pvt. Ltd.