Unlock IMPORTANT QUESTION
This question was bookmarked by 5 NEET 2025 toppers during their NEETprep journey. Get Target Batch to see this question.
✨ Perfect for quick revision & accuracy boost
Buy Target Batch
Access all premium questions instantly
In the following displacement \((x)\) versus time \((t)\) graph, at which points \(P, Q\) and \(R\) will the object's speed be increasing?

1. \(R\) only
2. \(P\) only
3. \(Q\) and \(R\) only
4. \(P,Q,R\)
Subtopic: Graphs |
Level 3: 35%-60%
Hints
The accompanying graph of position \((x)\) versus time \((t)\) represents the motion of a particle. If \(p\) and \(q\) are both positive constants, the expression that best describes the acceleration of the particle is:

1. \(a=-p-qt\)
2. \(a=-p+qt\)
3. \(a=p+qt\)
4. \(a=p-qt\)
Subtopic: Graphs |
Level 3: 35%-60%
Please attempt this question first.
Hints
Please attempt this question first.
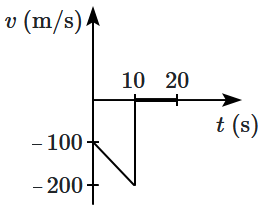
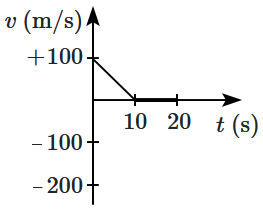
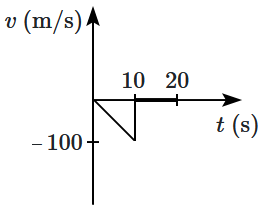
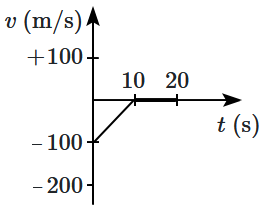
A bullet is shot vertically downwards with an initial velocity of \(100\) m/s from a certain height. Within \(10\) s, the bullet reaches the ground and instantaneously comes to rest due to a perfectly inelastic collision. The velocity-time curve for total time \(t=20 \) s is: (take \(g=10\) m/s2 )
| 1. |  |
2. |  |
| 3. |  |
4. |  |
Subtopic: Graphs |
53%
Level 3: 35%-60%
Please attempt this question first.
Hints
Please attempt this question first.
Unlock IMPORTANT QUESTION
This question was bookmarked by 5 NEET 2025 toppers during their NEETprep journey. Get Target Batch to see this question.
✨ Perfect for quick revision & accuracy boost
Buy Target Batch
Access all premium questions instantly
The velocity-time graph of a particle moving along a straight line is shown in the adjacent figure. The average velocity is:


| 1. | \(1~\text{ms}^{-1}\) | 2. | \(2~\text{ms}^{-1}\) m/s |
| 3. | less than \(1~\text{ms}^{-1}\) | 4. | greater than \(2~\text{ms}^{-1}\) |
Subtopic: Graphs |
Level 3: 35%-60%
Hints


