- 1(current)
 Q. No.
The arithmetic growth is exemplified by:
| 1. | A root elongating at a constant rate |
| 2. | The equation, \(L_t = L_0 + rt\) |
| 3. | A linear curve is obtained graphically when the length of an organ is plotted against time |
| 4. | All of the above |


Subtopic: Growth Model |
91%
Level 1: 80%+
Please attempt this question first.
Hints
Please attempt this question first.

The sigmoid growth and arithmetic growth can be represented graphically, respectively, as:
| 1. |  |
| 2. |  |
| 3. |  |
| 4. |  |
Subtopic: Growth Model |
90%
Level 1: 80%+
Please attempt this question first.
Hints
Please attempt this question first.
In an idealized sigmoid (S-shaped) growth curve, which of the following phases represents the period of maximum exponential growth in a plant?
| 1. | Lag phase, where initial slow growth occurs. |
| 2. | Log (exponential) phase, where growth rate increases rapidly. |
| 3. | Stationary phase, where growth rate stabilizes. |
| 4. | Senescence phase, where growth rate declines as nutrients become limiting. |
Subtopic: Growth | Growth Model |
89%
Level 1: 80%+
Please attempt this question first.
Hints
Please attempt this question first.


The exponential growth and arithmetic growth can be respectively expressed as:
1. \(W_1 = W_0e^{rt} ~, ~ L_t = L_0 +rt\)
2. \(L_t =L_0 +rt , W_1 = W_0e^{rt} \)
3. \(W_1 = W_0e^{rt} + L_0~, ~ L_t = rt+ W_0e^{rt}\)
4. \(W_1 = W_0e^{rt} ~, ~ W_1 = e^{rt}\)
1. \(W_1 = W_0e^{rt} ~, ~ L_t = L_0 +rt\)
2. \(L_t =L_0 +rt , W_1 = W_0e^{rt} \)
3. \(W_1 = W_0e^{rt} + L_0~, ~ L_t = rt+ W_0e^{rt}\)
4. \(W_1 = W_0e^{rt} ~, ~ W_1 = e^{rt}\)
Subtopic: Growth | Growth Model |
89%
Level 1: 80%+
Please attempt this question first.
Hints
Please attempt this question first.
Subtopic: Growth Model |
89%
Level 1: 80%+
Please attempt this question first.
Hints
Please attempt this question first.
Observe the sigmoid curve given below and identify the phases A, B, and C:

| 1. | A = Initial slow growth, B = Rapid growth, C = Phase of growth during limited nutrient supply |
| 2. | A = Rapid growth, B = Initial slow growth, C = Phase of growth during limited nutrient supply |
| 3. | A = Lag phase, B = Stationary phase, C = Exponential phase |
| 4. | A = Exponential phase, B = Stationary phase, C = Lag phase |
Subtopic: Growth Model |
84%
Level 1: 80%+
Please attempt this question first.
Hints
Please attempt this question first.


During the log phase of growth curve, which statement is correct?
| 1. | The growth rate is constant. |
| 2. | Growth rate increases exponentially with time. |
| 3. | The rate of anabolism equals that of catabolism. |
| 4. | There is no increase in growth rate. |
Subtopic: Growth | Growth Model |
83%
Level 1: 80%+
Please attempt this question first.
Hints
Please attempt this question first.
The growth of a root elongating at a constant rate will be represented by:
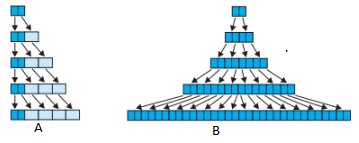
1. A only
2. B only
3. Both A and B
4. Neither A nor B
Subtopic: Growth Model |
79%
Level 2: 60%+
Hints
Plants follow different pathways in response to environment or phases of life to form different kinds of structures. This ability is called:
| 1. | Cryptobiosis | 2. | Developmental noise |
| 3. | Plasticity | 4. | Norm of the reaction |
Subtopic: Growth | Growth Model | Growth Terminology |
97%
Level 1: 80%+
Please attempt this question first.
Hints
Please attempt this question first.


The phenomenon of heterophylly in plants is an example of:
| 1. | Pleiotropy | 2. | Plasticity |
| 3. | Convergence | 4. | Saltation |
Subtopic: Growth Model |
95%
Level 1: 80%+
Please attempt this question first.
Hints
Please attempt this question first.
- 1(current)
Q. No.© 2026 GoodEd Technologies Pvt. Ltd.